
Concerns Around the Australian Banks: ASX Bank FCN Risk Briefing 2026
Last reviewed: June 2026
Look, the banks are not having a great time right now. The press has been hammering them, hedge funds have built a record $11 billion short position against the Big Four, and brokers are cutting targets every other week. If you hold a Fixed Coupon Note referenced to CBA, NAB, ANZ, WBC or Macquarie, you'd be forgiven for feeling uneasy about the 9.5 to 11 percent per year on offer.
But here's the thing most of that coverage is missing: de-rating is not the same as collapse. A broker cutting their CBA target to $111 is not the same as a broker saying CBA will lose 40 percent of its value. And those two things matter very differently for your FCN.
The question everyone keeps asking is "will the banks fall?" They already are. The only question that actually matters for your capital is whether the worst-performing stock in your basket will still be sitting 40 percent below its June 2026 starting price two years from now. Put actual numbers to that, and the picture looks very different from what you'd get reading the financial press.
How does the 40% barrier on an ASX bank FCN actually work?
This is a European barrier, and that distinction is doing a lot of heavy lifting in the current environment. Worth spelling it out clearly.
A European barrier is only tested once, on the final observation date, which for this note falls in June 2028. Not during the term. Not when the next round of broker downgrades hits. Not during whatever the next shock is. Once, at maturity.
Your capital is returned in full as long as the worst performer in the basket closes less than 40 percent below its starting price on that single date. The note pays 9.5 to 11.0 percent per annum in monthly coupons throughout the 2-year term regardless. And there's a 6-month autocall: if all reference stocks are sitting above their starting prices at the halfway mark, the note calls early and you pocket the coupons ahead of schedule.
In other words, the note doesn't need the banks to go up. It just needs them to still be reasonably close to where they started.
| Feature | Detail |
|---|---|
| Coupon rate | 9.5% – 11.0% p.a. (paid monthly) |
| Reference basket | 3 of: CBA, ANZ, NAB, WBC, MQG |
| Barrier type | European (tested at maturity only) |
| Barrier level | 40% below starting price |
| Term | 2 years (matures June 2028) |
| Autocall | 6 months: early return if all stocks above strike |
| Worst-of mechanic | Barrier tested on weakest stock in basket only |
How far would ASX bank stocks need to fall for the barrier to break?
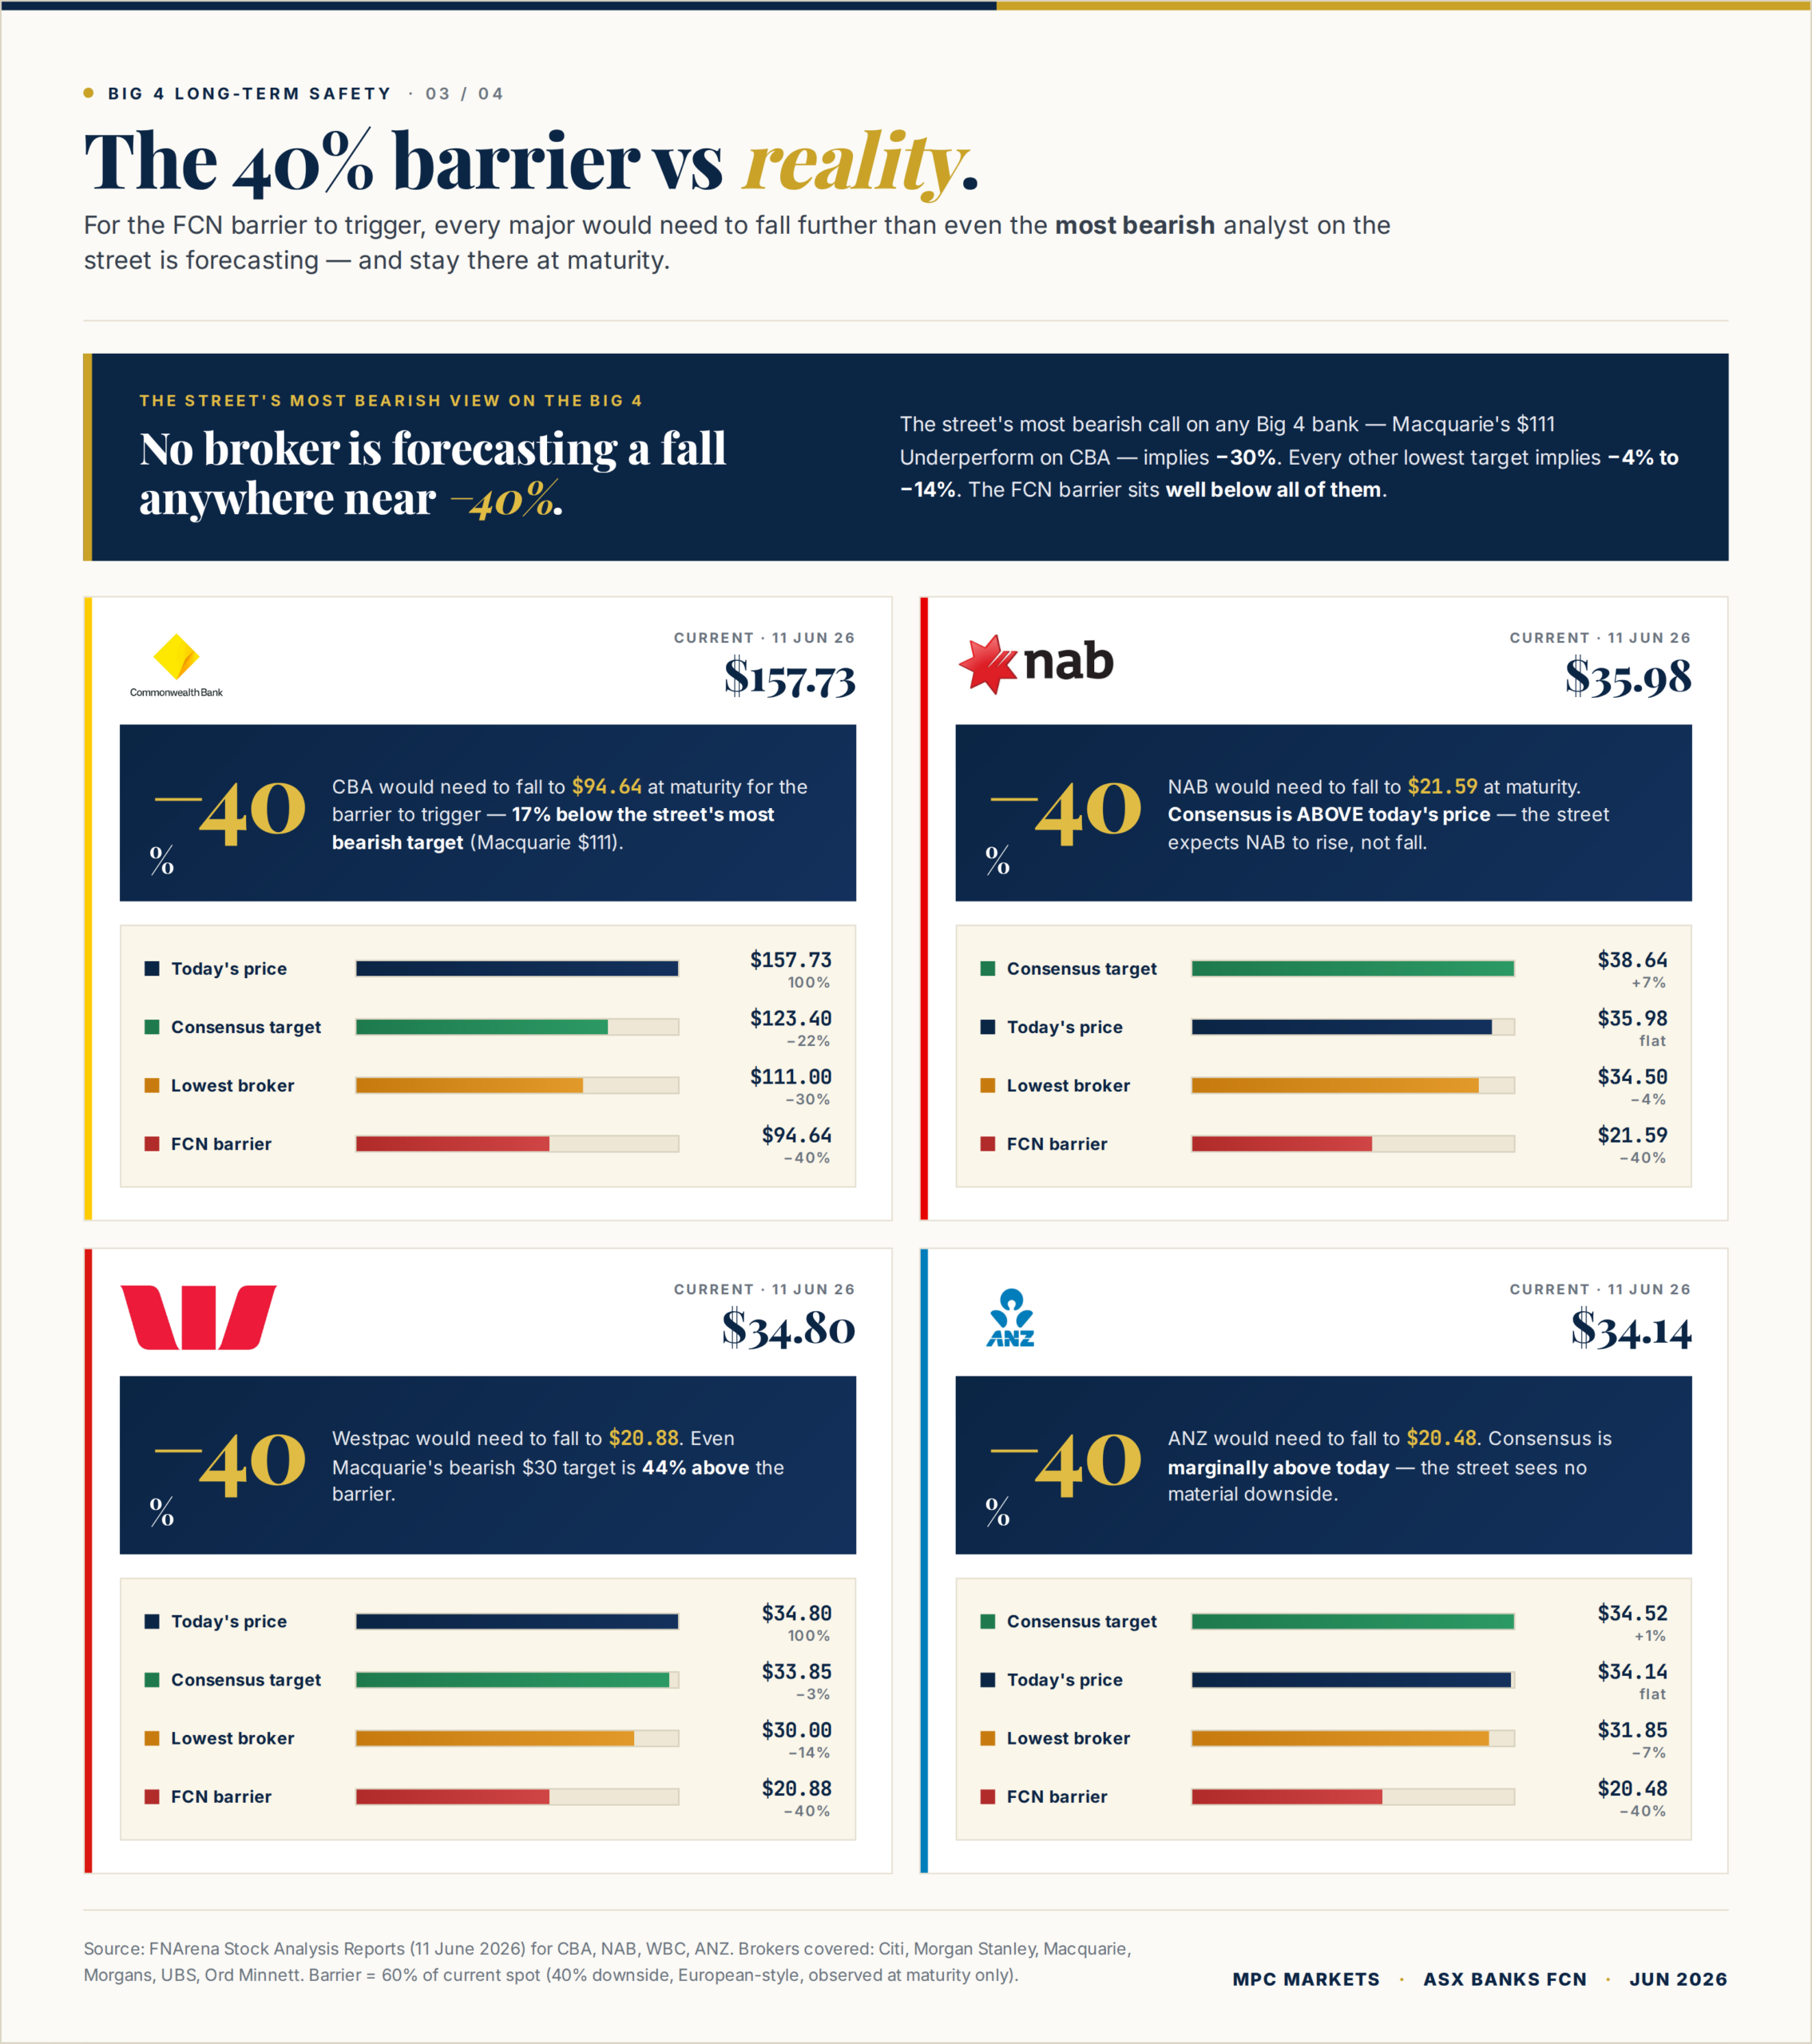
Based on approximate closing prices on 11 June 2026, here is what "40 percent lower in June 2028" actually means in dollar terms for each stock in the basket.
| Stock | Approx. Starting Price | 40% Barrier Level | Most Bearish Street Target | Buffer Above Barrier |
|---|---|---|---|---|
| CBA | approx. $158 | approx. $95 | $111 (Macquarie, Underperform) | approx. 17% |
| NAB | approx. $37 | approx. $22 | Bear case implies -10% to -30% | 10%–30% |
| WBC | approx. $35 | approx. $21 | Bear case implies -10% to -30% | 10%–30% |
| ANZ | approx. $33 | approx. $20 | Bear case implies -10% to -30% | 10%–30% |
| MQG | Current price | -40% from start | Not specified in current data | Varies |
The column that matters most here is the buffer above barrier. Even Macquarie's most bearish published target on CBA , the $111 Underperform, is sitting around 17 percent above the barrier price. The bears on the street are not forecasting a 40 percent collapse. They're forecasting a de-rating. And a de-rating, uncomfortable as it feels in the moment, is a very different animal from the kind of fall that would put your capital at risk.
The hedge fund short position is worth addressing too, because it keeps coming up. Eleven billion dollars sounds enormous. Against a combined Big Four market cap of around $650 billion, that's roughly 1.7 percent short interest. It's a directional bet on earnings compression and valuation multiple contraction. It is not a bet on insolvency, and the two are not remotely the same thing. A short squeeze in the other direction is just as plausible at these levels.
Earning 9.5–11% p.a. on ASX bank exposure
Fixed Coupon Notes give you a defined income stream and a 40% capital buffer, without taking on direct bank stock risk. See how they work and whether they suit your portfolio.
Explore Fixed Coupon NotesHas a 40% sustained bank drawdown ever actually happened in Australia?
Watch: How Fixed Coupon Notes Work in Practice
This short video walks through the mechanics and a real scenario example using ANZ, CBA, WBC, and NAB at 9.25% p.a.
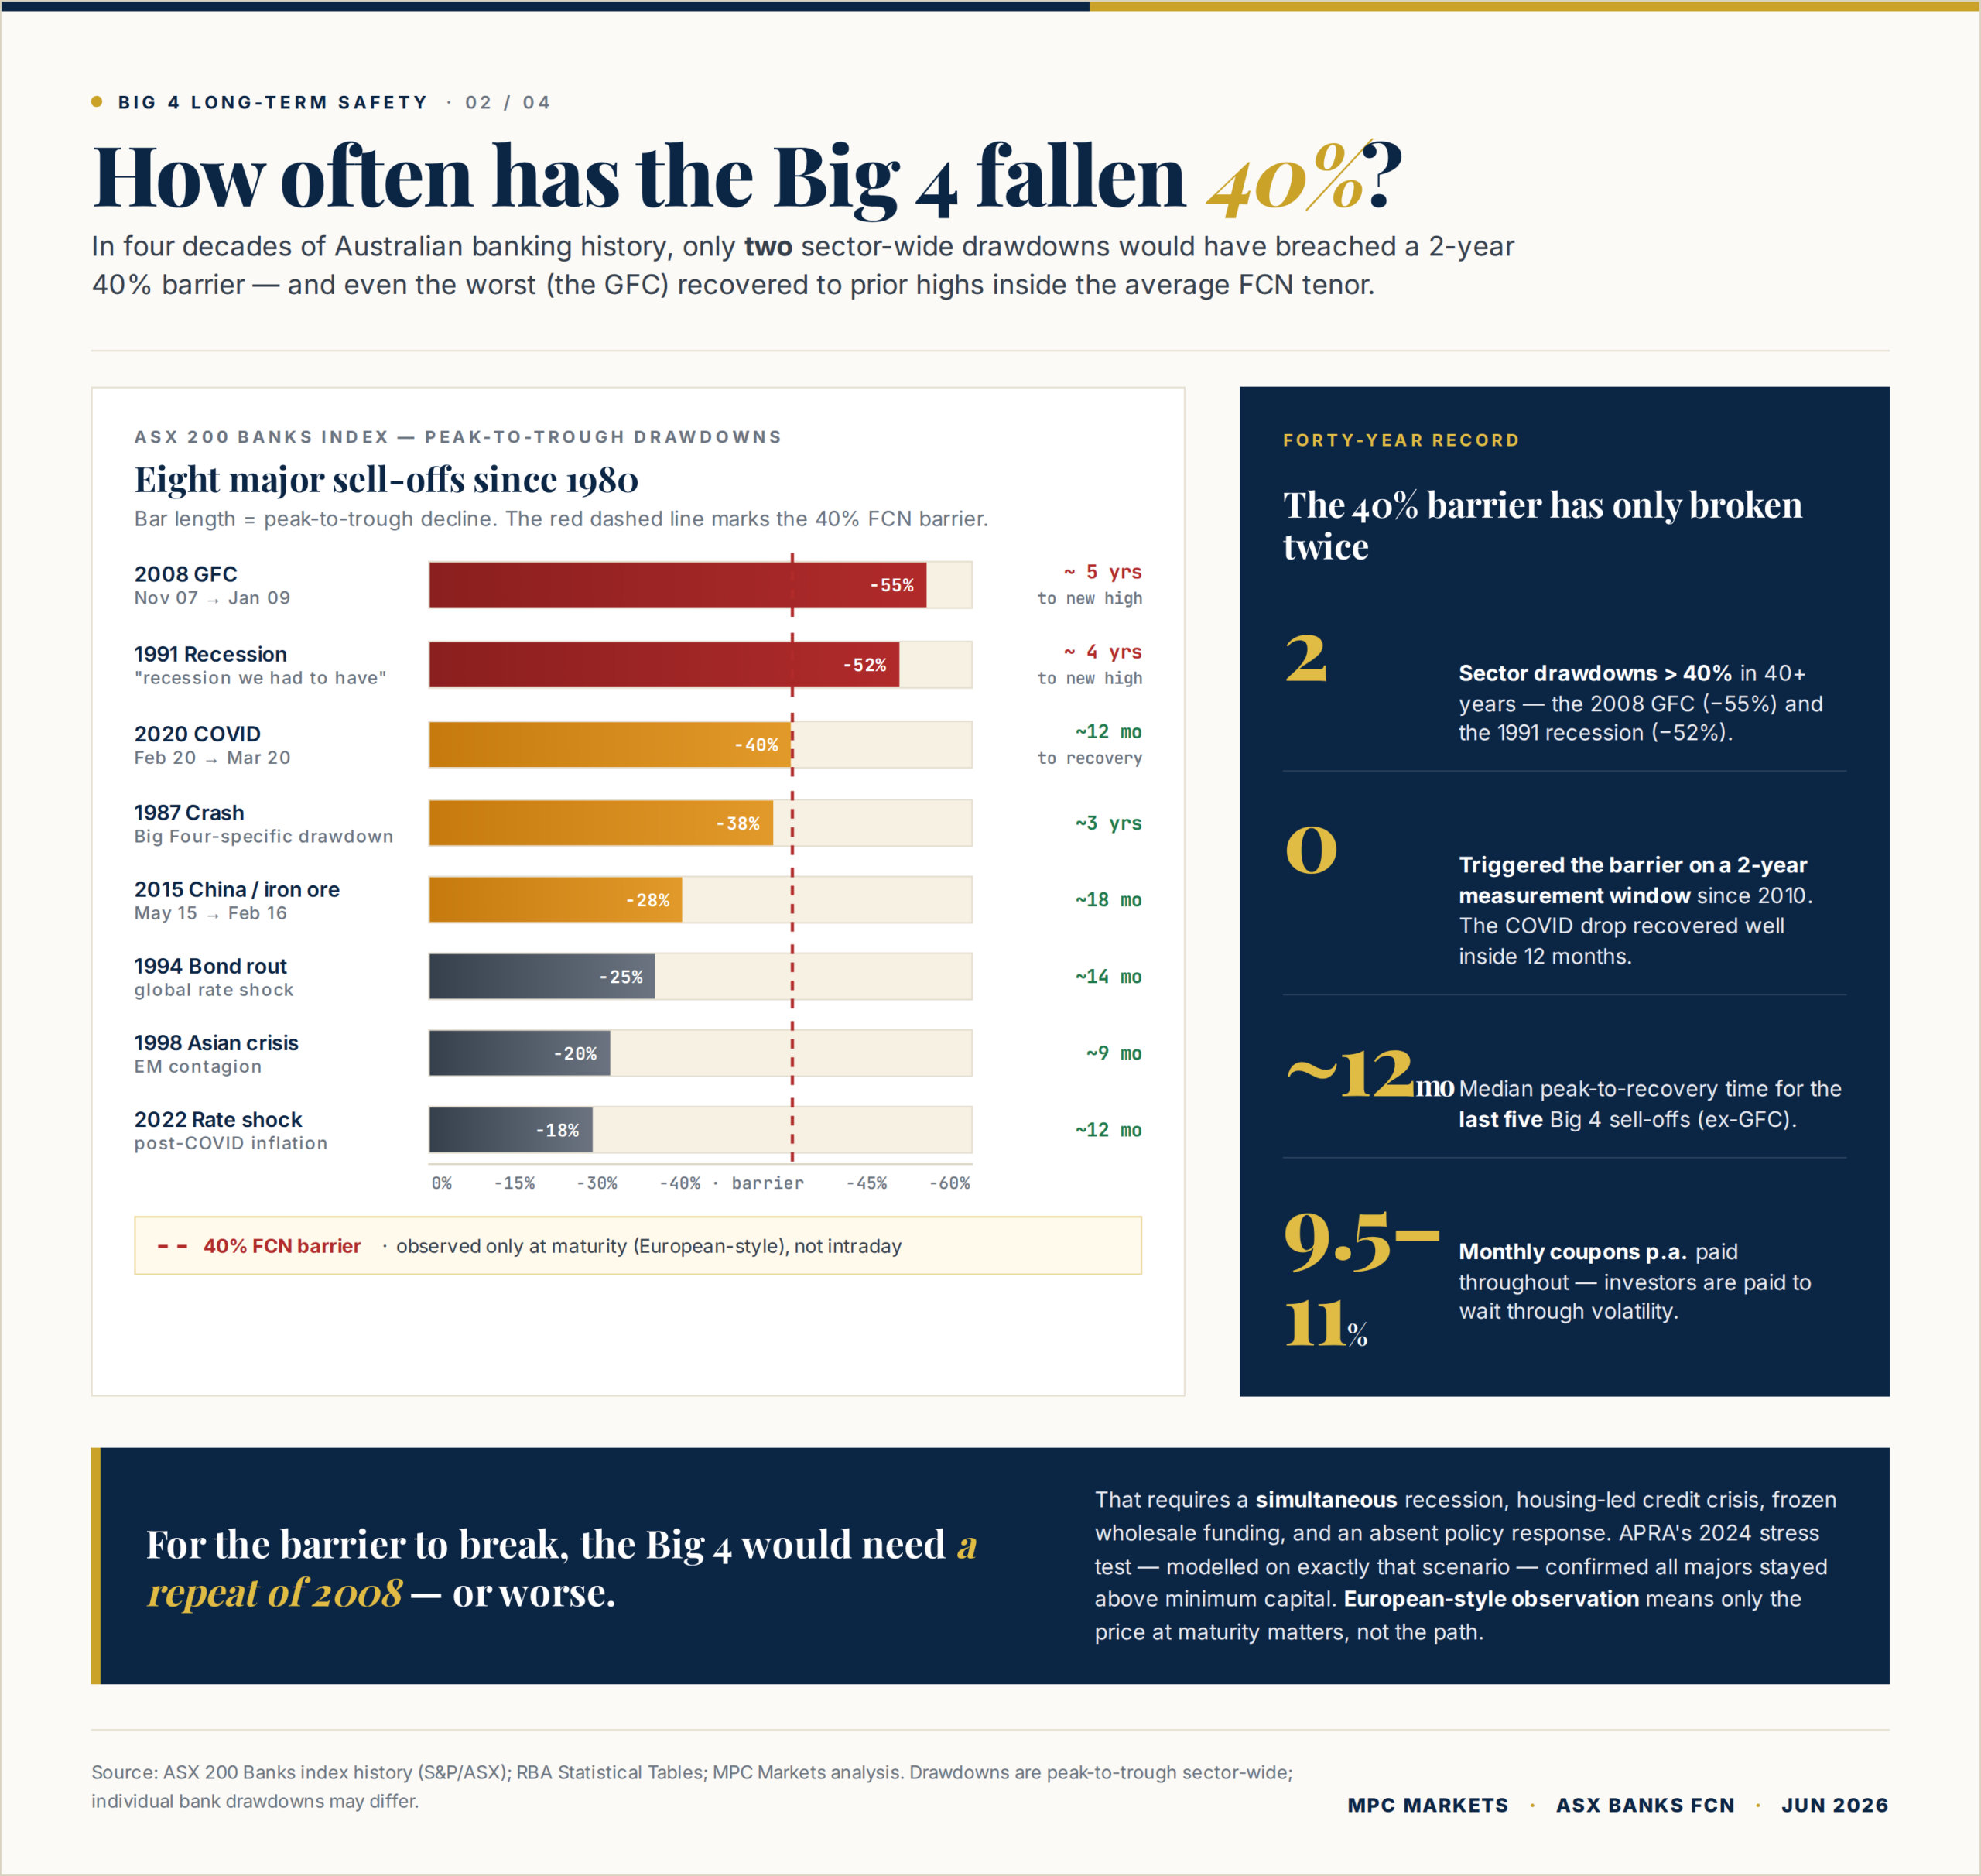
In the modern era, effectively once, and it needs some context.
The 1990-91 recession did push Australian bank stocks through a 40 percent drawdown on a peak-to-trough basis, and recovery took 3 to 4 years on price alone. That is the genuine historical tail risk this product is paid for, and we're not going to pretend otherwise. But the macro setting that preceded 1991 looked nothing like today: double-digit interest rates, a corporate debt binge, an overheating property market with none of the LVR discipline that exists post-GFC, and an RBA that was still finding its footing.
The GFC is the more commonly cited reference, and the story there is more nuanced. Australian bank stocks did fall through 40 percent on price during 2008-09. CBA bottomed around $24 in early 2009. But the recovery was fast. By mid-2010 CBA was back above $50, well within a 2-year window. Most FCNs issued in 2007 or early 2008 cleared maturity without a barrier breach, because the final observation date landed after the recovery had taken hold.
COVID is the most recent test case. ASX bank stocks punched below the 40 percent intraday drawdown level in March 2020. But the RBA launched the Term Funding Facility, the federal government rolled out JobKeeper and mortgage repayment holidays, and the ASX 200 was back near its February peak inside 12 months. Any FCN maturing from mid-2021 onward cleared the barrier comfortably.
And the current bear cycle? The press coverage has been dramatic, but the actual drawdown as of June 2026 is in the order of 15 to 20 percent from recent highs, well short of the barrier. The distance between "banks are having a bad year" and "banks are 40 percent lower than they started" is a very long way.
What macro conditions would actually cause the barrier to break in June 2028?
This is where it's worth separating "bad year for banks" from "barrier breach scenario." These are different levels of severity by a significant margin.
For the worst-performing stock in a Big Four basket to still be 40 percent below its June 2026 starting price in June 2028, you'd need all of the following holding simultaneously.
A full-blown Australian recession. Not the soft landing that most broker models are pencilling in. We're talking unemployment running from around 4 percent today to above 7 percent, and staying there through the remainder of 2027.
A genuine housing crash, not a correction. Morgan Stanley's "biggest house price correction in 40 years" call, which made headlines recently, still implies a managed decline. The barrier scenario needs a disorderly one, around 25 to 30 percent in dwelling values, sustained. The average mortgage book LVR of 70 percent means prices need to fall roughly 30 percent before widespread unsecured losses become a portfolio-level problem.
Material credit losses at scale. The Big Four's loan loss rates would need to spike from around 10 basis points currently to GFC-era levels of 70 to 100 basis points, and hold there across a full credit cycle.
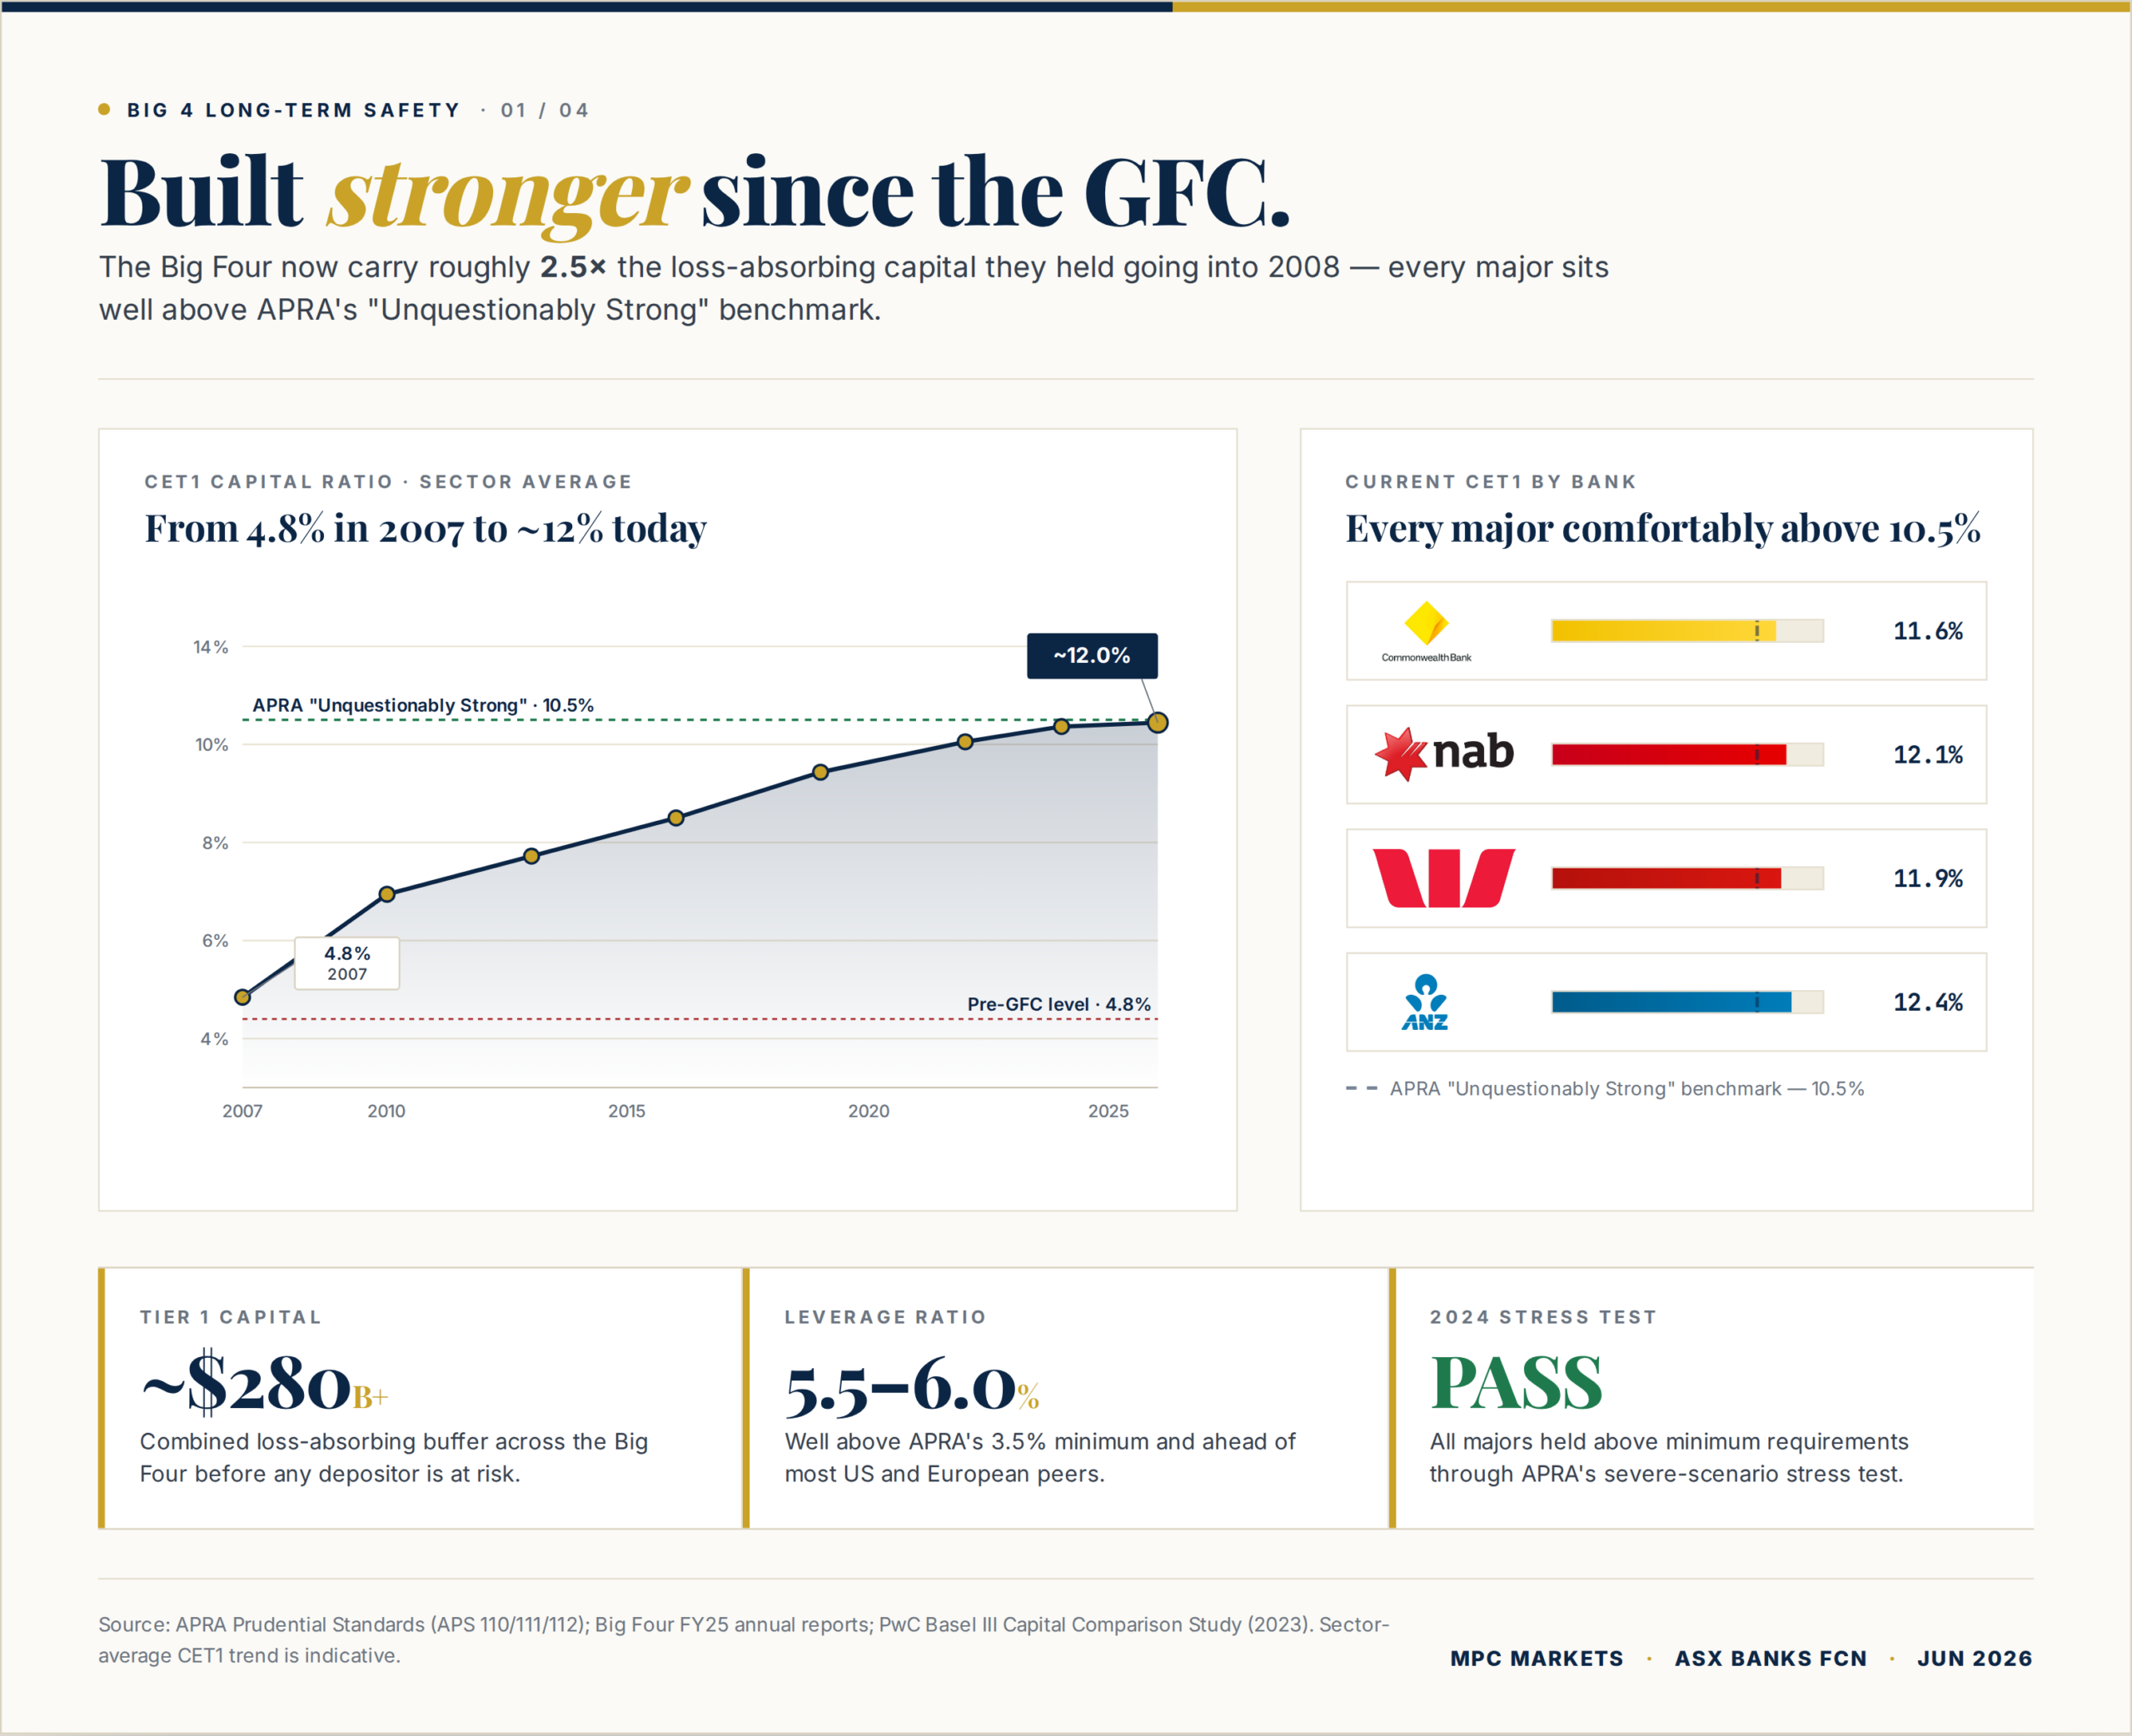
Dilutive equity capital raisings. APRA forcing the banks to raise equity at distressed prices, as happened in 2008 and 2009, compressing book value per share sharply. This requires CET1 ratios to fall well below minimums first. CBA at 11.6 percent and ANZ at 12.39 percent have meaningful buffer before that pressure builds.
Zero effective policy response. The RBA cutting hard, the AOFM buying paper, government guarantees, fiscal stimulus, none of it working. That scenario didn't materialise in COVID, didn't materialise in the GFC's Australian chapter, and would represent something genuinely without precedent in the modern era of central bank intervention.
All five conditions simultaneously. Sustained for the full two-year term. That is what breaks a 40 percent barrier on a basket of the best-capitalised banks in the country. And that, not a broker downgrade or a hedge fund short, is what 9.5 to 11 percent per year is compensating you for.
| Scenario | Bear Case (Broker Consensus) | Barrier Breach Scenario |
|---|---|---|
| Unemployment | Rises to 4.5%–5.0% (soft landing) | Rises above 7%, sustained |
| Housing prices | -5% to -15% (managed correction) | -25% to -30%, disorderly |
| Loan loss rate | 15–25 bps (mild deterioration) | 70–100 bps (GFC-era levels) |
| CET1 capital | Holds above 11% (APRA "unquestionably strong") | Falls below minimums, dilutive raising required |
| Policy response | RBA cuts 100–150 bps, fiscal support active | Policy response fails to stabilise |
| Bank stock impact | -10% to -30% de-rating | More than -40% at final observation date |
Want a second opinion on your portfolio's income exposure?
If you're holding bank stocks directly, there may be a more capital-efficient way to access the same yield. Our portfolio review looks at your whole picture, not just individual positions.
Get Your Portfolio ReviewedWhy are the Big Four structurally safer today than in 1991 or 2008?
Post-GFC, post-Basel III, the Australian major banks are genuinely different institutions from the ones that wobbled in 1991. The current bearish thesis is almost entirely about earnings, not solvency. And the barrier doesn't care about earnings.
CET1 capital ratios tell much of the story. CBA is at 11.6 percent and ANZ at 12.39 percent. APRA's "unquestionably strong" threshold starts at 10.5 percent, meaning both banks are carrying a buffer above the buffer. In 2008, the system was running closer to 6 percent. The gap matters enormously when credit conditions deteriorate.
On the mortgage book, average loan-to-value ratios sit around 70 percent across the Big Four, with lenders' mortgage insurance required on anything above 80 percent. For dwelling prices to start creating unsecured losses at scale across the portfolio, they'd need to fall around 30 percent from current levels. Morgan Stanley's much-discussed "biggest correction in 40 years" call still puts peak-to-trough at something like 10 to 15 percent. There's a long way between those numbers and the barrier scenario.
And APRA's macroprudential toolkit is now battle-tested rather than theoretical. Serviceability buffers, debt-to-income limits, investor lending caps. These were deployed during the 2017-19 housing slowdown and held the portfolio structure conservative through the bull run. The banks didn't lend recklessly on the way up, which means the correction on the way down is more manageable.
The RBA backstop matters too. The Term Funding Facility rolled out in 2020 was a direct intervention in bank funding costs at a time when credit markets were seizing up. It worked. The Big Four never stopped lending. Dividends were maintained. That's a policy toolkit that didn't exist in 1991 and wasn't deployed aggressively enough in 2008. It's part of the structural context that the barrier is underwriting.
The current short thesis on the banks is about earnings de-rating and net interest margin compression as rates fall. That's real, we're not dismissing it, and it's part of why we're cautious on the sector for direct equity exposure. But de-rating is a valuation call. The barrier only cares about survival, not re-rating.
So what are you actually being paid to do with an ASX bank FCN?
You're being paid 9.5 to 11.0 percent per annum to underwrite the view that CBA doesn't trade through around $95, NAB doesn't trade through around $22, WBC doesn't trade through around $21, and ANZ doesn't trade through around $20 at a single observation point in June 2028.
That's an equity-like return for underwriting a credit-event-level risk on the most regulated, best-capitalised financial institutions in the country. The asymmetry is the whole point of the structure.
And even if the barrier is breached. Let's say the worst stock in the basket finishes 41 percent below its starting price. The math still looks better than direct exposure. On a $100,000 investment, you'd receive approximately $59,000 in shares at the barrier price. But you've also banked around $20,000 in coupons over the 24-month term at 10 percent. Total economic outcome: approximately $79,000. A loss of around 21 percent from your starting capital.
For context, if you'd held that $100,000 directly in the worst-performing bank stock, you'd be sitting on $59,000. The coupons provide a genuine $20,000 buffer in the bad scenario. That's not nothing, and it's often overlooked in the anxiety around barriers.
Income that doesn't depend on the market going up
If protecting capital while generating income is the goal, the Wealth Protector strategy is designed exactly for that outcome. See how it fits with structured products like FCNs.
Explore Wealth ProtectorFrequently Asked Questions
What is a European barrier on an ASX bank Fixed Coupon Note?
A European barrier is tested only once, tested on the final observation date at maturity, not at any point during the note's term. For a 2-year ASX bank FCN, this means the 40% threshold is checked on a single date in June 2028. Intraday falls or temporary drawdowns during the 2 years do not trigger the barrier. Capital is returned in full at maturity unless the worst-performing stock in the basket closes more than 40% below its starting price on that one date.
How far do Australian bank stocks need to fall to break a 40% FCN barrier?
Based on approximate closing prices on 11 June 2026, a 40% barrier breach would require CBA to trade around $95 (from approximately $158), NAB around $22 (from approximately $37), WBC around $21 (from approximately $35), and ANZ around $20 (from approximately $33) at the final observation date. The most bearish analyst target currently on CBA. Macquarie's $111 Underperform still sits around 17% above the barrier level.
Has an ASX bank FCN barrier ever been breached historically?
In the modern era, a sustained 40% final-date barrier breach in a Big Four basket has effectively only occurred in conditions approaching the 1990-91 recession. During the GFC, major bank stocks fell through 40% on a price basis but recovered sufficiently over 2-year holding periods for most notes. COVID delivered a sharp intraday drawdown in March 2020, but Australian bank stocks recovered to above their starting prices within 12 months, well before any 2-year note would have matured.
What happens to my money if an ASX bank FCN barrier is breached?
If the worst-performing stock in the basket closes more than 40% below its starting price at maturity, the investor receives shares (or cash equivalent) at the barrier price rather than original capital. On a $100,000 investment at a 41% breach, this means approximately $59,000 in stock. However, coupons collected over the 2 years (at 10% p.a.) total around $20,000, giving a total economic outcome of approximately $79,000, a 21% loss, materially better than direct exposure to a stock down 41%.
Should ASX bank FCN holders be worried about hedge fund short positions?
The current $11 billion hedge fund short against the Big Four represents only around 1.7% of the combined $650 billion market cap. This is a directional bet on earnings de-rating, not a solvency call. FCN barriers are breached by balance-sheet events such as capital impairment, material credit losses, and forced equity dilution, not by valuation de-ratings. Short interest at current levels is consistent with a slow earnings grind, not a systemic collapse of the kind needed to breach a 40% barrier.

Mark Gardner
Founding CEO, MPC Markets
30 years in markets across trading, derivatives, ASX & US stocks, and structured investments. Regular financial media contributor for SBS World News, Sky News, Reuters, Ausbiz, 7+, Livewire Markets, Market Index, Stockhead, Sydney Morning Herald & the Age.
This article is general educational information and does not constitute personal financial advice. Fixed Coupon Notes and other structured products involve risk, including the possible loss of capital. The barrier scenarios and price levels discussed are based on approximate closing prices as of 11 June 2026 and are used for illustrative purposes only. Actual product terms, barrier levels, coupon rates, and reference stocks will differ between specific notes. Past performance is not a guarantee of future results. Before making investment decisions, consider your personal circumstances, investment objectives, risk tolerance, and time horizon. Consult a licensed financial adviser if you need personalised advice. MPC Markets and its representatives provide general advice only. Sources: FNArena Stock Analysis Reports (11 June 2026); MPC ASX Banks Monthly FCN term sheet; RBA Bulletin: Securities Markets through COVID-19; RBA: The Global Financial Crisis.