Is OpenAI the Poster-Child of AI, or the AI Bubble?
You would think that the company that brought us ChatGPT – the one that supposedly aces every math test thrown at it – would be able to do the math on its own business model and cash-flow forecasts. But apparently not.
7 Candlestick Patterns Every Investor Should Know
Candlestick charts, invented by Japanese rice trader Munehisa Homma in the 18th century, are a powerful tool for visualizing price movements and market sentiment. Each candlestick shows an asset’s open, high, low, and close prices for a period, revealing the battle between buyers (bulls) and sellers (bears). Green or white candles indicate bullish closes (close > open), while red or black signal bearish ones (close < open). Understanding these patterns can help predict short-term reversals or continuations, but always confirm with other tools like support/resistance or volume.
DIY US Employment Data – US Corporate Lay-off announcements
In the absence of US Govt figures from the BLS, we collated the publicly announced corporate lay-offs
Investing in an AI Automation & Robotics Future
Free AI Robotics Thematic Webinar and E-Book
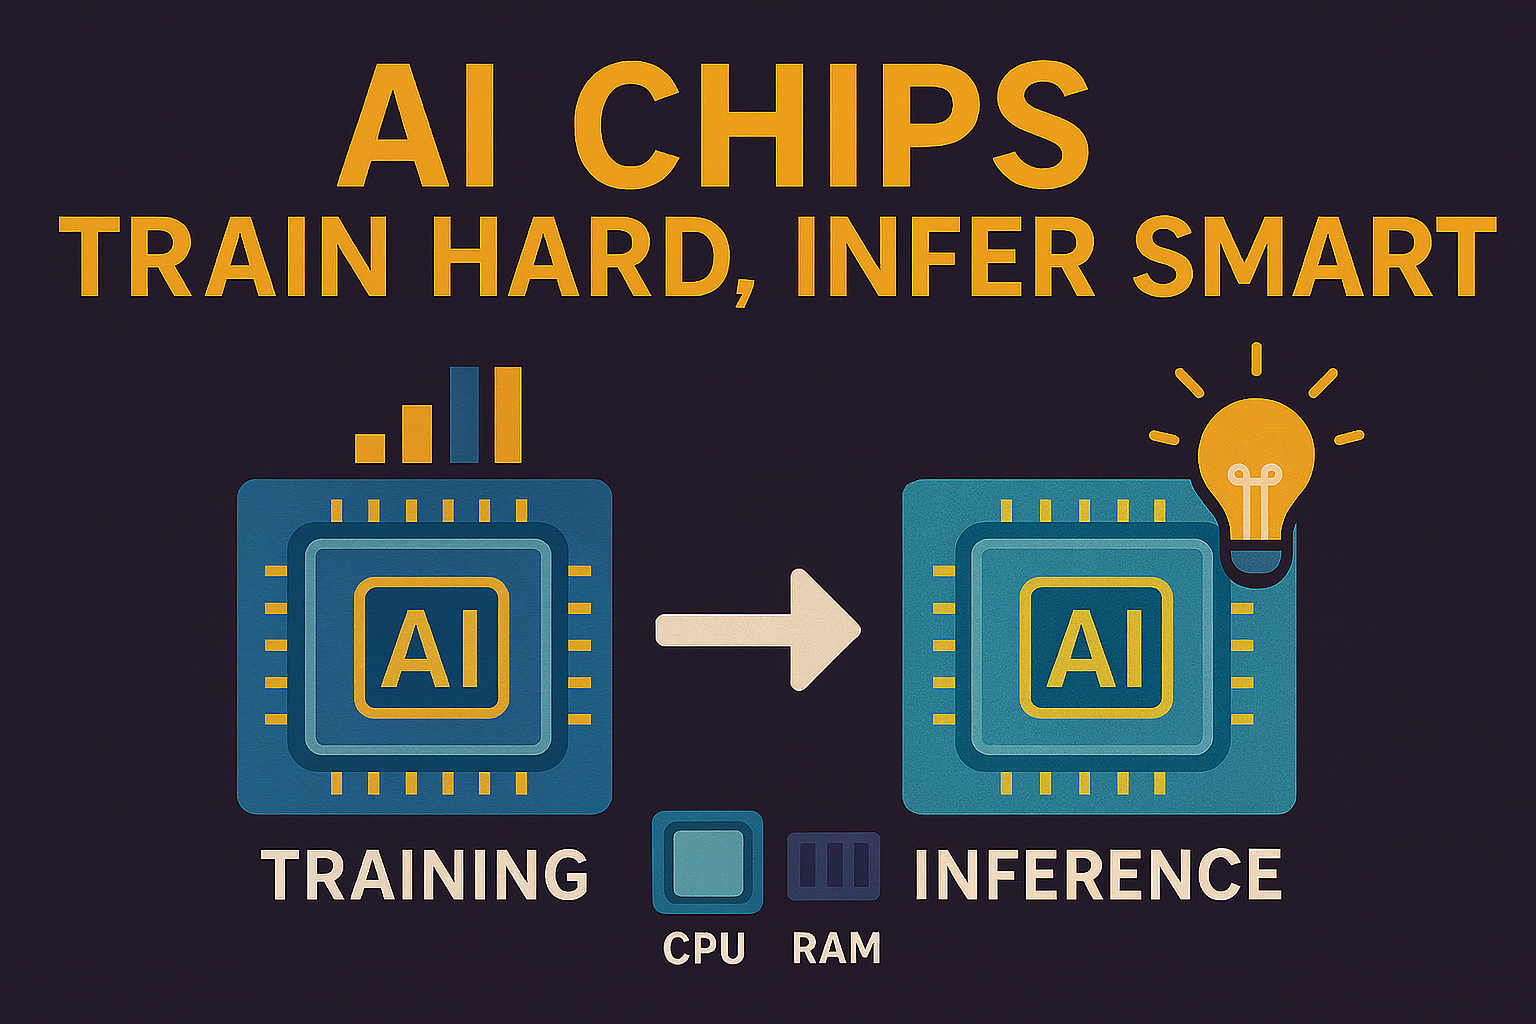
Understanding Training, Inference Chips and the Competitive Landscape
For investors navigating the AI hardware landscape, distinguishing between training chips and inference chips is crucial. This guide breaks down their key differences, explores practical uses across industries, highlights leading players like NVIDIA’s market dominance and emerging challengers such as Qualcomm, and explains why standard CPUs and RAM fall short for handling large language models—equipping you to spot investment opportunities in this evolving sector.

High Conviction: Taking 1/3 Profit on Silver Breakout to Multi-Year Highs (ETPMAG)
MPC Markets recommends taking profit on one-third of the ETPMAG position at 95.5, following a strong and extended rally in silver that has delivered approximately 140% upside from initial entry.
Weekend Edition EP99: Central bank divergence & “choose your own” Economic Data
The episode concludes with insights into commodities and market trends, emphasizing the importance of understanding these evolving technologies in the financial landscape.