THE MORNING CALL POST HAS MOVED TO MOSIAC
You can now listen & Watch to the Pre Market Pulse

Is OpenAI the Poster-Child of AI, or the AI Bubble?
You would think that the company that brought us ChatGPT – the one that supposedly aces every math test thrown at it – would be able to do the math on its own business model and cash-flow forecasts. But apparently not.

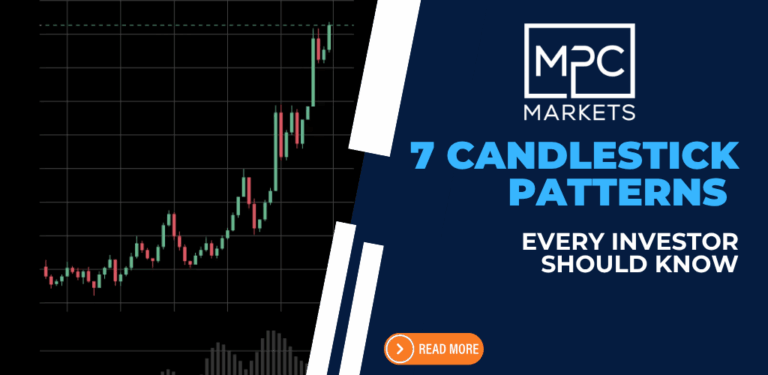
7 Candlestick Patterns Every Investor Should Know
Candlestick charts, invented by Japanese rice trader Munehisa Homma in the 18th century, are a powerful tool for visualizing price movements and market sentiment. Each candlestick shows an asset’s open, high, low, and close prices for a period, revealing the battle between buyers (bulls) and sellers (bears). Green or white candles indicate bullish closes (close > open), while red or black signal bearish ones (close < open). Understanding these patterns can help predict short-term reversals or continuations, but always confirm with other tools like support/resistance or volume.


