
Valuation metrics are flashing RED as seasonal weakness looms
As August 2025 draws to a close, the S&P 500 sits near all-time highs, but beneath the surface, cracks are appearing. Overvaluation signals are blaring, compounded by the infamous seasonal slump that historically plagues late summer and early fall. Investors eyeing the calendar should brace for potential turbulence, as August and September have long been synonymous with underperformance, volatility spikes, and drawdowns. With economic indicators softening, this period could amplify risks, urging a closer look at capital preservation strategies without abandoning long-term optimism.
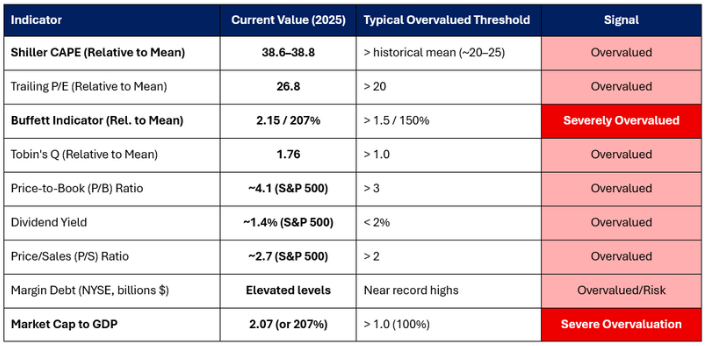
First, let’s dissect the overvaluation. The US equity market is stretched thin, with key metrics far exceeding historical norms. The Shiller CAPE ratio, which smooths earnings over 10 years, stands at 39.18—more than double its long-term mean of 17.27. This suggests prices are detached from fundamentals, echoing preludes to past corrections like 2000 and 2008. The trailing P/E ratio is equally alarming at 30.15, against a historical average of 16.16. The Buffett Indicator, measuring total market cap to GDP, hovers at 214.4%-217%, signaling significant overvaluation well above fair value thresholds around 100-150%. Dividend yields are compressed at 1.18%, far below the 4.22% historical average, implying limited income cushion. These extremes are fueled by mega-cap tech dominance, speculative margin debt, and passive inflows, creating a fragile setup vulnerable to mean reversion.
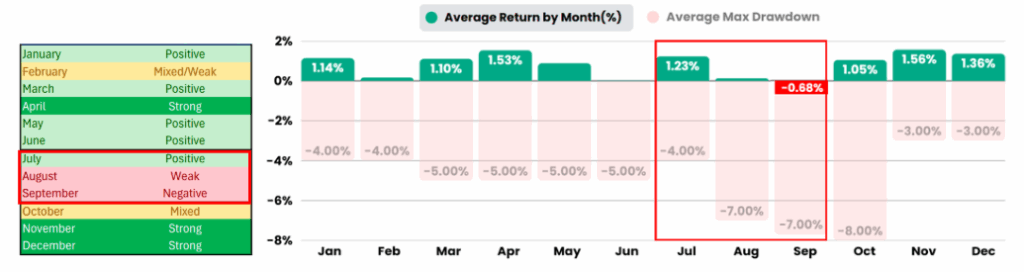
Now, enter seasonal weakness—a well-documented phenomenon where the S&P 500 tends to falter in late US summer. Since 1950, August has averaged a near-flat -0.01% return, while September is the weakest month at -0.72%. This pattern stems from reduced trading volumes, summer investor uncertainty, and repositioning ahead of fall earnings. Historical data shows larger-than-average drawdowns, with September posting negative returns more often than not. For instance, over the past century, the index has declined in September about 55% of the time, contrasting with stronger months like November (1.50%) and December (1.36%). Recent years reinforce this: volatility often surges, amplifying corrections amid overbought conditions.
Compounding factors include weakening economics. An inverted yield curve has predicted nearly every recession in 35 years, flashing slowdown risks. Declining consumer confidence, rising unemployment, and Fed tightening add pressure. Geopolitical tensions and sentiment surveys show professionals viewing stocks as overpriced, fostering risk aversion.
Yet, history reminds us bull markets prevail long-term, with average durations of 997 days and 96% returns versus bear markets’ 289 days and -29%. As September beckons, these red flags warrant vigilance—overvaluation meets seasonal headwinds, potentially sparking a pullback. Sophisticated investors, stay alert; the market’s resilience shines brightest after storms.
REGISTER FOR THE WEBINAR


GENERAL ADVICE WARNING:
Recommendations and reports managed and presented by MPC Markets Pty Ltd (ABN 33 668 234 562), as a Corporate Authorised Representative of LeMessurier Securities Pty Ltd (ABN 43 111 931 849) (LemSec), holder of Australian Financial Services Licence No. 296877, offers insights and analyses formulated in good faith and
Opinions and recommendations made by MPC Markets are GENERAL ADVICE ONLY and DO NOT TAKE INTO ACCOUNT YOUR PERSONAL CIRCUMSTANCES, always consult a financial professional before making any decisions.