When Investors Can't Agree: What Extreme Bull/Bear Polarisation Often Signals
Last reviewed: July 2026
Your X feed right now is a warzone. One side screaming "greatest bull market ever." The other insisting the crash is imminent. And almost nobody calmly occupying the middle ground.
None of this is new. That kind of sharp split in investor opinion is actually one of the more reliable features of late-cycle markets. Research going back seven decades shows that when disagreement gets this extreme, you're often closer to a turning point than most people realise. Not tomorrow necessarily. But the conditions are there.
This piece walks through the evidence, the key charts, and what it actually means for your portfolio. No crystal ball predictions. Just the pattern recognition that matters.
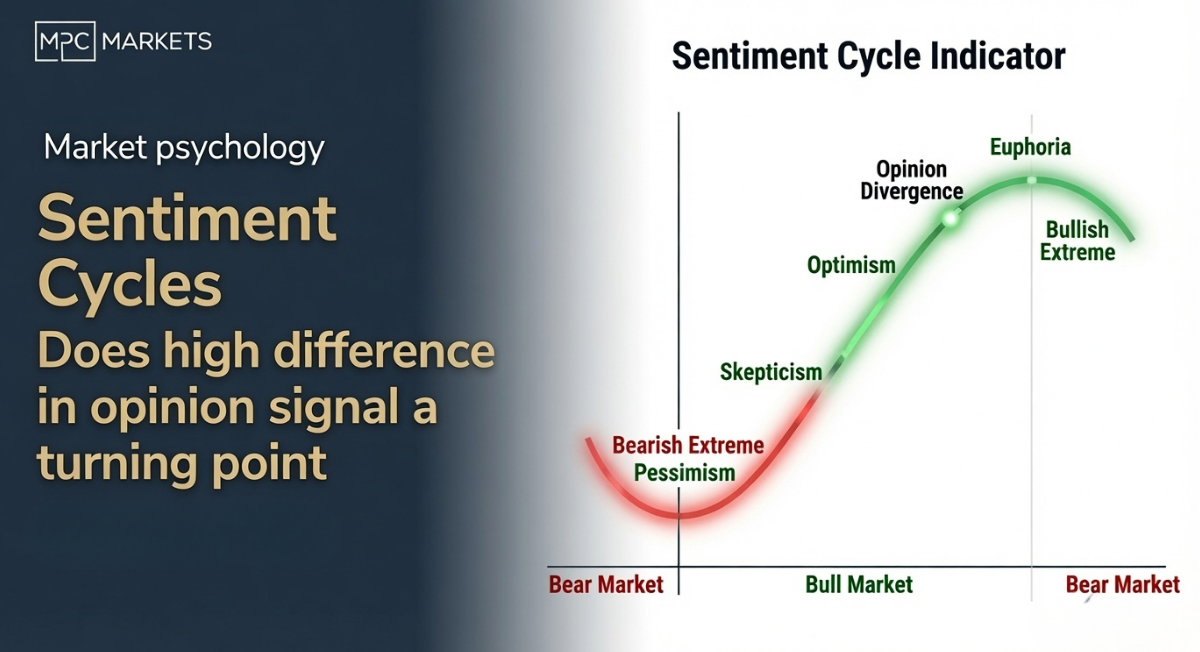
What does the classic sentiment cycle look like?
Sir John Templeton nailed it decades ago: bull markets are born on pessimism, grow on scepticism, mature on optimism, and die on euphoria. Simple enough. And broadly true.
At the start of a bull run, almost everyone is gloomy. Prices climb. Scepticism slowly gives way to optimism, and near the end many investors become convinced the good times will roll on forever. Bear markets follow the reverse arc.
But here's what's different about the current moment. We're not seeing one side dominate. We're seeing both extremes screaming at each other simultaneously. That's not consensus euphoria. It's polarisation. And historically, that's a different animal entirely.
| Phase | Dominant Sentiment | Market Behaviour | Typical Duration |
|---|---|---|---|
| Birth | Deep pessimism, capitulation | Bottoming, forced selling exhausted | 3-6 months |
| Growth | Scepticism, "dead cat bounce" fears | Steady climb, wall of worry | 1-3 years |
| Maturity | Optimism, rising participation | Broadening rally, FOMO buying | 1-2 years |
| Euphoria / Polarisation | Sharp disagreement, extreme views | Narrow leadership, high volatility | 3-12 months |
Why does extreme disagreement matter more than average sentiment?
Markets aren't driven by one "average" investor. They're driven by the tug-of-war between groups with fundamentally different perspectives. And when those groups disagree violently, interesting things happen.
Retail investors tend to extrapolate recent returns. When the S&P 500 (or the ASX 200) has been running hot, they pile in expecting more of the same. Professional and institutional investors are more likely to focus on valuations and mean reversion, which makes them cautious when prices stretch.
When these two camps pull in opposite directions for sustained periods, you get three things:
- Higher trading volume and volatility as both sides express their convictions
- Prices that stay elevated longer than fundamentals alone would justify, because the bearish "smart money" faces real limits to arbitrage (shorting is expensive, and being early is the same as being wrong)
- Lower future returns on average. Academic research covering seven decades of US market data finds that stocks with high forecast dispersion tend to underperform those with low dispersion over subsequent 12-month periods
A market where 40% of participants are extremely bullish and 40% are extremely bearish is a very different beast from one where most people are mildly optimistic. The average sentiment reading might look similar, but the underlying dynamics are poles apart.
How Does Your Portfolio Handle Volatility?
When sentiment is split, stress-testing your positioning matters more than usual. Our free portfolio review identifies concentration risks and gaps before the market moves.
Get Your Free Portfolio ReviewWhat does the historical evidence actually show?
The AAII Sentiment Survey
The American Association of Individual Investors has been surveying retail sentiment weekly since 1987. It's not perfect. But it's one of the longest-running, most-studied sentiment measures we have.
The bull-bear spread (bullish percentage minus bearish percentage) has repeatedly hit extremes near major turning points. And the pattern is consistent enough to pay attention to:
- Extreme bearish readings clustered around major bottoms: late 2008, March 2009, March 2020, October 2022
- Extreme bullish readings appeared near peaks or late-stage advances: early 2000, late 2007, early 2018, late 2024
- As of late July 2026, bullish sentiment sat at 29.6% while bearish hit 42.3%, producing a notably negative spread
| AAII Sentiment Extreme | Date | S&P 500 Level | What Followed (12 months) |
|---|---|---|---|
| Peak bearishness | Mar 2009 | 676 | +68% rally |
| Peak bearishness | Mar 2020 | 2,237 | +75% rally |
| Peak bearishness | Oct 2022 | 3,577 | +22% rally |
| Peak bullishness | Jan 2000 | 1,469 | -12% decline (dot-com burst) |
| Peak bullishness | Oct 2007 | 1,565 | -38% decline (GFC) |
| High polarisation | Jul 2026 | 5,600+ | TBD |
Here's the interesting part. Extreme consensus pessimism has been a far better historical buy signal than extreme consensus optimism has been a sell signal. Bearish extremes produced average 12-month forward returns north of 20%. Bullish extremes were messier, sometimes preceding immediate declines, sometimes just mediocre returns for a year or two.
Analyst forecast dispersion
When professional analysts disagree widely about future earnings for the same company, it has historically predicted higher risk of business-cycle turning points. During long expansions, some analysts cling to optimistic projections while others start adjusting downward. The gap widens before the consensus finally breaks one way.
Cross-sectional research from Diether, Malloy and Scherbina (published in the Journal of Finance, 2002) found that stocks with high analyst forecast dispersion underperformed those with low dispersion by around 9.5% annually. The market, it turns out, doesn't price disagreement correctly.
Market internals and breadth deterioration
This is where it gets practical for ASX investors. Even when the headline index looks strong, the breadth of the advance can quietly fall apart underneath. John Hussman and others have documented that widening internal divergences frequently appear near major peaks.
What does that look like? More stocks making new 52-week lows even as the index holds near highs. Sector leadership narrowing to a handful of names. In 2000 it was tech. In 2007 it was financials. In 2024-25, it was the AI-adjacent mega-caps.
On the ASX, we've seen something similar play out with the S&P/ASX 200 being dragged higher by a narrow group: Commonwealth Bank (ASX: CBA) trading at historically stretched multiples, the big iron ore names like BHP Group (ASX: BHP) and Rio Tinto (ASX: RIO), and a few tech darlings. Meanwhile plenty of small and mid-cap names have gone sideways or worse.
Make Sense of the Noise
When everyone's got a strong opinion, it helps to ground your view in structured research. Our investment recommendations cut through the noise with specific ASX ideas.
See Our Latest RecommendationsWhat does the current set-up look like for mid-2026?
We reckon the current environment has several hallmarks of late-cycle polarisation. Not a prediction. Just pattern recognition.
Here's what we're seeing:
- Institutional cash levels have been low, with some professional sentiment indicators running elevated through early 2026
- Retail surveys have swung cautious. The AAII bull-bear spread recently turned notably negative (29.6% bulls vs 42.3% bears as of late July)
- Consumer confidence remains weak relative to where stock prices are sitting, a disconnect that's widened over recent quarters
- AI stocks remain a flashpoint. Ask ten investors whether NVIDIA (NASDAQ: NVDA) or the ASX AI-adjacent plays are overvalued and you'll get ten passionate, contradictory answers
Think of it like a party that's gone on too long. Some guests are still dancing enthusiastically. Others are checking their watches and muttering about calling an Uber. Very few are calmly enjoying the music. And social media's algorithms are making sure you hear the loudest voices from both camps.
What should you actually do with this information?
We're not going to pretend we can call the exact top. Nobody can, and anyone who tells you they can is selling something. But there are some practical things worth doing when polarisation is this elevated.
First, treat polarisation as context, not a timing tool. High disagreement raises the odds you're in a late-cycle phase, but cycles can stretch longer than anyone expects. It's one input alongside valuations, breadth, and your own time horizon.
Second, watch the spread, not the average. A market split 40/40 with 20% neutral is qualitatively different from one that's 60% mildly bullish. The distribution matters more than the mean.
Third — and this one's easy to forget — social media is a distorted mirror. Algorithms reward emotion. The calm, evidence-based middle view gets almost no visibility. Don't let your X feed set your risk tolerance.
It also helps to understand the asymmetry here. Extreme consensus pessimism has been a much better buy signal historically than extreme consensus optimism has been a sell signal. Polarisation sits somewhere between those poles, which makes it useful but not decisive.
And finally, focus on process over prediction. Rather than trying to call the exact inflection point, ask yourself: "Given current valuations and this level of disagreement, am I being adequately compensated for the risks I'm carrying?"
Major market cycles rarely end with everyone holding the same view. They tend to end amid growing disagreement, some investors still extrapolating the recent trend while others are already preparing for mean reversion. The split you see on X right now is consistent with that pattern.
That's not a reason to panic. And it's not a reason to abandon a long-term plan. But it is a reason to double-check position sizes, review your diversification, and make sure your portfolio can handle a stretch of higher volatility without forcing bad decisions. We've been doing exactly that with our own positioning over the past few weeks.
Join Our Next Live Webinar
We cover market sentiment, positioning, and specific ASX ideas in our regular webinars. It's a good way to stress-test your own views against our research.
Register for a WebinarFrequently Asked Questions
What does extreme bull/bear polarisation mean for investors?
Extreme polarisation, where roughly equal numbers of investors are strongly bullish and strongly bearish, has historically appeared in the later stages of major market cycles. It does not guarantee an imminent top or bottom, but research covering seven decades of data shows elevated disagreement often precedes periods of higher volatility and lower forward returns for equity markets.
How does the AAII sentiment survey signal market turning points?
The AAII Investor Sentiment Survey measures the percentage of individual investors who are bullish, bearish, or neutral each week. When the bull-bear spread hits extremes, it has historically aligned with turning points. Extreme bearish readings clustered around major bottoms like March 2009 and March 2020, while extreme bullish readings appeared near peaks or late-stage advances.
Why do retail and institutional investors often disagree at market peaks?
Retail investors tend to extrapolate recent returns, becoming more bullish as prices rise. Institutional and professional investors are more likely to focus on valuations and mean reversion, turning cautious when prices stretch. This structural difference in approach means the two groups frequently pull in opposite directions during late-cycle conditions, and sustained divergence has historically coincided with elevated market stress.
Is high investor disagreement a reliable sell signal?
No. High disagreement raises the probability that a market is in a late-cycle phase, but cycles can extend longer than expected. Academic research shows extreme consensus pessimism has been a better historical buy signal than extreme consensus optimism has been a sell signal. Polarisation is best used as one input alongside valuations, market breadth, and fundamentals, not as a standalone timing tool.
What should I do with my portfolio when investor sentiment is highly polarised?
Review your position sizing and diversification. Ensure your portfolio can withstand a period of higher volatility without forcing you to sell at the wrong time. Consider whether you are being adequately compensated for the risks you are taking at current valuations. This is not a time to panic or abandon a long-term plan, but it is a time to stress-test your holdings and rebalance where needed.
This article is general educational information and does not constitute personal financial advice. Past performance is not a guarantee of future results. Before making investment decisions, consider your personal circumstances, investment objectives, risk tolerance, and time horizon. Consult a licensed financial adviser if you need personalised advice. MPC Markets and its representatives provide general advice only. All examples are illustrative and do not constitute recommendations. Data is current as of July 2026 and is subject to change.