Author name: Mark Gardner

CEO Mark brings more than 25 years of experience in fixed-income and equities trading. He takes a holistic approach to investing, specialising in top-down thematic and macro analysis to identify opportunities and trends in the Australian and global equity market. Qualifications: Derivatives Level 2 (ADA2); ADA1; Margin Lending Tier 1; RG146; General Advice Stockbroking (1997) Links: LinkedIn: https://www.linkedin.com/in/mark-gardner-88733334/ X: https://x.com/markgardn Livewire: https://www.livewiremarkets.com/contributors/mark-gardner-mpc-markets

Education

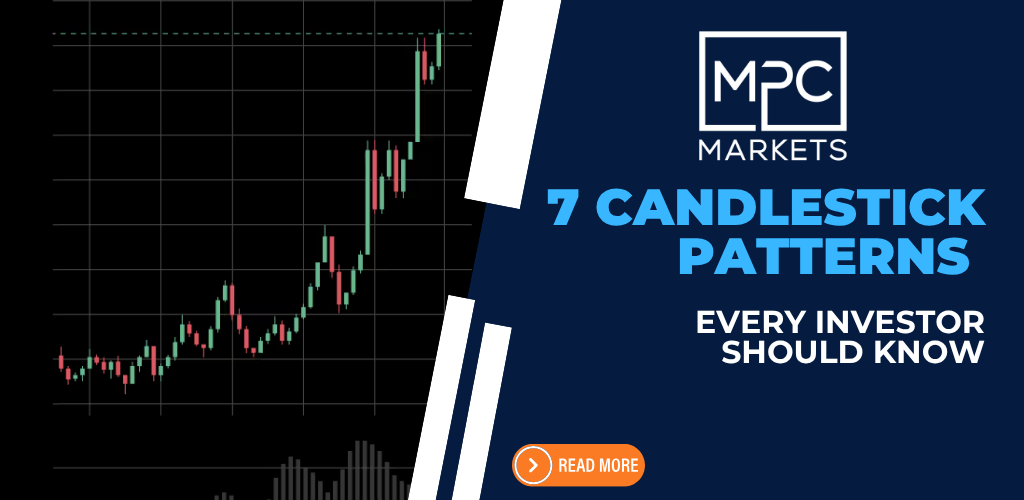
7 Candlestick Patterns Every Investor Should Know

Candlestick charts, invented by Japanese rice trader Munehisa Homma in the 18th century, are a powerful tool for visualizing price movements and market sentiment. Each candlestick shows an asset’s open, high, low, and close prices for a period, revealing the battle between buyers (bulls) and sellers (bears). Green or white candles indicate bullish closes (close > open), while red or black signal bearish ones (close < open). Understanding these patterns can help predict short-term reversals or continuations, but always confirm with other tools like support/resistance or volume.


Bulls vs. Bears

Weekend Edition EP93: Corporate Lay-offs signal weakness in US Labour market

U.S. and Australian markets have seen increased volatility and cautious sentiment, with a notable surge in U.S. layoffs, mixed performances across sectors, and shifting investor moods captured both in corporate results and social media reactions. Mark and Jonathan from MPC Markets take a bearish stance, highlighting investor anxiety, disconnects between market levels and sentiment, and the importance of staying informed and cautious as market dynamics evolve.​

Scroll to Top