Don't Lean on Earnings Forecasts: Why Wall Street Won't Warn You Before the Next Drop
Last reviewed: September 2026
Here's the thing nobody on a research morning call wants said out loud. Consensus earnings forecasts do not tell you a bear market is coming. They tell you it has already started. And right now, with oil back above US$100, Treasury yields at levels we haven't seen since 2007, US federal debt north of $40 trillion and a genuine military escalation between the US and Iran, the market should be a lot lower than it is. But it isn't. Why?
Because a lot of people are leaning on two things: AI earnings and analyst forecasts. We reckon both of those are shakier than they look. And if you're using either as your reason to stay fully invested, you need to read what follows.
Why do so many investors treat earnings forecasts as gospel?
There's a comforting logic to it. Earnings go up, share prices go up. Analysts say earnings will grow 10% next year, so everything is fine. We've heard some version of this on every panel, every webinar, every research note for the last six months. "Earnings estimates are holding up, so the dip is a buying opportunity."
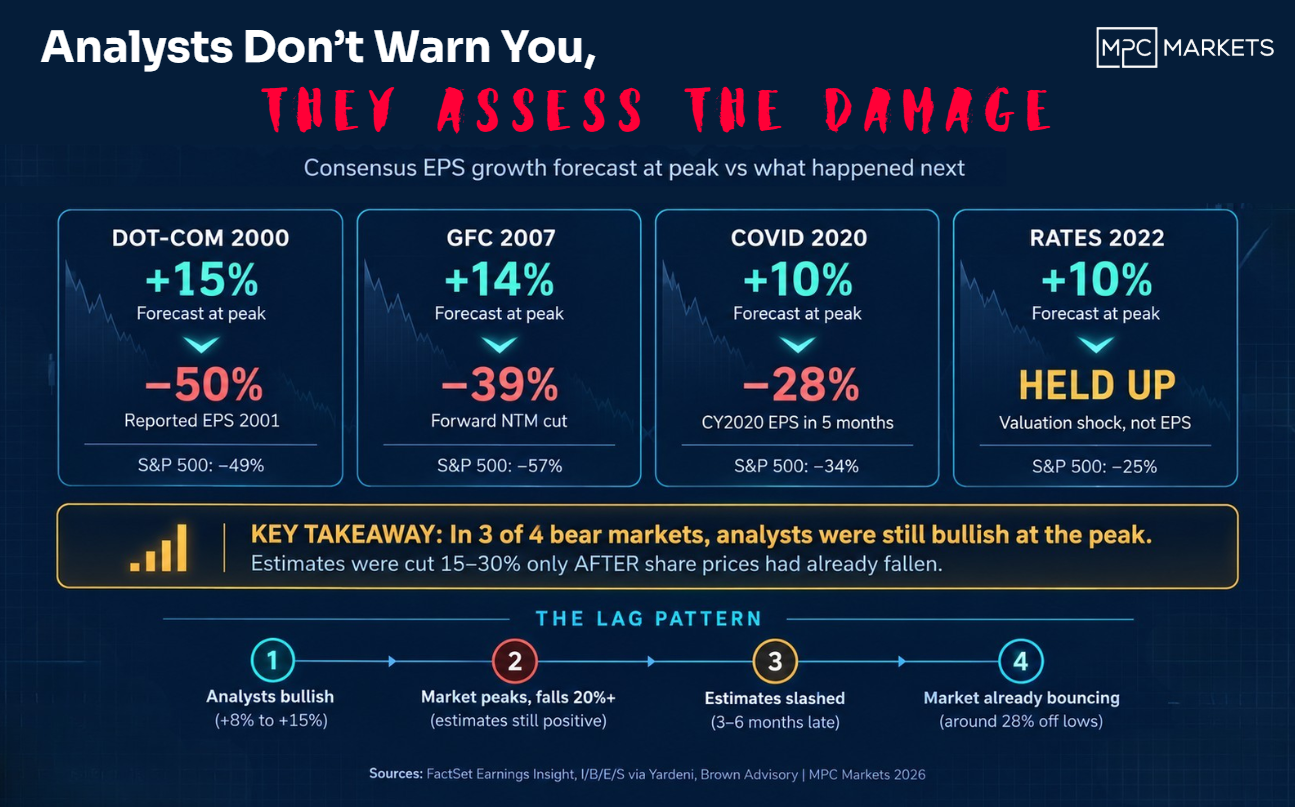
The problem is the historical record tells a different story entirely. In every earnings-driven bear market since 2000, analysts were still forecasting strong profit growth as the S&P 500 peaked. They didn't cut estimates until after share prices had already done most of the falling.
They don't warn you. They notarise the damage.
What happened to earnings forecasts before the last four bear markets?
We pulled the FactSet and I/B/E/S point-in-time data. Not revised historical series, not backward-looking smoothed numbers. The actual forecasts that were live on the day. And the pattern is pretty clear.
| Bear Market | S&P 500 Peak Decline | Consensus Growth at Peak | Estimate Cut (First 6 Months) |
|---|---|---|---|
| Dot-com (Mar 2000) | -49% | +12% to +15% | Reported EPS fell around 50% in 2001 |
| GFC (Oct 2007) | -57% | +14% to +15% | Forward NTM cut around 39% |
| COVID (Feb 2020) | -34% | +9.6% | CY2020 EPS cut around 28% in 5 months |
| 2022 (Jan 2022) | -25% | +9% to +10% | Estimates initially rose (rates shock, not earnings) |
Sources: FactSet Earnings Insight (Dec 2019, Feb 2020, Jun 2022, Jan 2023), I/B/E/S via Yardeni Research, Brown Advisory NTM estimate paths.
Look at that. In three of the four, analysts walked into the peak forecasting high-single to mid-teens growth. Then the index dropped 20% or more. Then, and only then, did the estimates get chopped. The COVID one is the most striking. On 3 January 2020, consensus had calendar-year EPS at $177.77. On 21 February, two days after the high, they'd barely blinked: $175.98. By the end of May it was $128. That's minus 28% in five months, the largest cut FactSet had recorded since they started tracking in 1996.
And if your process is "wait for the Street to turn cautious," you were already late by the time that happened.

Is Your Portfolio Built on Assumptions?
If earnings forecasts are the main reason you're staying the course, it might be time to pressure-test that view. Our portfolio review takes 15 minutes and gives you an independent second opinion.
Get Your Portfolio ReviewedWhat's actually holding this market up right now?
We count two pillars. Both of them are weaker than they appear.
Pillar 1: AI earnings. A handful of US mega-caps are carrying the S&P 500's earnings growth number. Strip out the top 5–7 names and the rest of the index is flat to negative on a forward earnings basis. And here's the part that gets glossed over on the morning shows: a meaningful chunk of those AI "earnings" aren't operating profits from selling products. They're unrealised investment gains.
Microsoft, Amazon, Google, and others have poured billions into Anthropic, OpenAI, and a handful of other AI companies. Those investments get marked up when the next funding round prices higher. So when Anthropic's valuation gets revised from $60 billion to $100 billion, or OpenAI's goes past $150 billion, the corporate investors book a gain. That gain flows through to earnings. It looks like profit. But nobody has sold anything. Nobody has received a dollar of cash. It's a paper gain sitting on top of a private-market valuation that has never been tested by public-market selling pressure.
If those valuations correct, even by 20–30%, you're looking at billions in writedowns flowing back through the same earnings line. And the "AI is carrying the market" story falls apart the same way the dot-com "eyeballs are revenue" story did. Slowly at first, then very quickly.
Pillar 2: Analyst forecasts. We've covered this above. They're a lagging indicator dressed up as a leading one. The forecasts look strongest when the risk is greatest, because analysts extrapolate the current quarter's results, not next quarter's risks. Company guidance is their main input. When management is confident, analysts are confident. By the time management cuts guidance, the share price has already moved.
What are the macro risks the market is ignoring?
We count at least four that would normally have the market down 10–15% already. The fact that it isn't tells you how much work those AI earnings are doing as a psychological anchor.
Oil above US$100
Brent crude has pushed back through US$100/bbl on the back of OPEC+ production discipline and the US-Iran escalation choking Strait of Hormuz risk premiums back into the price. Every sustained move above $100 since 2000 has coincided with either a recession, a bear market, or both. It is a tax on consumption and a margin compressor for every company that ships, manufactures, or heats anything.
US Treasury yields at 19-year highs
The 10-year yield is sitting above 5%, levels not seen since 2007. That was the year the GFC started. Higher yields mean higher discount rates, which means the present value of future earnings goes down, which means growth stocks, and the entire AI trade, get repriced. It also means mortgage rates stay elevated, consumer credit gets more expensive, and corporate refinancing costs go up. None of this is theoretical. It is already happening.
US federal debt past $40 trillion
The US government is adding roughly $1 trillion in new debt every 100 days. Interest payments on that debt now exceed the entire defence budget. At 5% yields, the interest expense alone is approaching $2 trillion a year. That's money that isn't going into infrastructure, stimulus or anything else that might support growth. It's a structural drag, and it gets worse the longer yields stay elevated.
US-Iran escalation
This isn't a background risk anymore. Direct military engagement between the US and Iran has pushed the Strait of Hormuz risk premium back into oil prices and created a genuine supply-disruption scenario. Around 20% of the world's oil passes through the Strait. A partial closure, even temporary, would send crude to $120+ and tip several European economies into recession within a quarter.
Why is September 2026 particularly dangerous?
September is already the worst-performing calendar month for the S&P 500. That's not an opinion, it's the data going back to 1928. But in midterm election years, the seasonal weakness gets worse. September-October drawdowns in midterm years have averaged roughly 1.5 to 2 times the normal seasonal drag, driven by a combination of policy uncertainty, fund rebalancing, and the kind of political noise that makes institutional investors pull duration out of their books.
We've written about this before in our September seasonal weakness piece. The setup this year is the same pattern with bigger inputs. Oil wasn't above $100 last time. Yields weren't at 19-year highs. The US wasn't in a shooting war with Iran. And the national debt wasn't adding a trillion every hundred days.
Stack those on top of the seasonal pattern and you've got a market that's being held up by a narrow set of AI mega-cap earnings, in the worst month of the year, in a midterm year, with four macro headwinds all blowing at once.
How Exposed Are You to AI Concentration Risk?
Most Australian portfolios have more US mega-cap exposure than investors realise, through global ETFs and managed funds. A 15-minute portfolio review can show you exactly where you stand.
Book a Portfolio ReviewWhat's really going on with AI earnings?
Let's be specific, because this is the bit that matters most.
When we talk about AI "earnings" propping up the S&P 500, we're not talking about companies selling AI products and booking revenue. Some are, of course. Microsoft's Azure AI, Amazon's Bedrock, Google's Vertex. Those are real revenue lines. But a large portion of the earnings uplift is coming from something else entirely: the carry value of private investments.
Here's how it works:
- Big Tech company invests $2 billion in a private AI firm at a $20 billion valuation
- Next funding round prices the AI firm at $60 billion
- The investor marks up its stake from $2 billion to $6 billion
- That $4 billion unrealised gain flows through the income statement
- Analysts include it in forward earnings estimates
- The S&P 500 "earnings" look stronger than the actual operating business
The problem should be obvious. These are paper gains on private companies that have never been tested by public-market selling pressure. Anthropic's valuation is whatever the last funding round says it is. OpenAI's is whatever their board and their latest investor agreed on. These aren't market-clearing prices. They're negotiated marks between parties who both have an incentive to see the number go higher.
If private AI valuations correct by even 25%, you're looking at tens of billions in writedowns flowing back through the earnings of the same companies that are carrying the index. And the "AI earnings story" becomes the "AI earnings problem" very quickly.
How does this hit Australian investors?
If you think this is a US-only problem, look at the correlation data. When the S&P 500 sells off hard, the ASX follows within days. Sometimes hours. Australian super funds, global equity ETFs like VGS (ASX: VGS), and international managed funds all carry heavy US mega-cap exposure. Your default super option probably has 30–40% in US equities, and a large chunk of that is concentrated in the same AI names carrying the S&P 500 earnings number.
On top of that, the Aussie dollar tends to weaken during US risk-off events, which partially offsets the loss in AUD terms but also means imported inflation pressures intensify. Oil above US$100 in a weaker AUD means higher fuel prices at the bowser, higher input costs for Australian manufacturers, and more pressure on the RBA to keep rates elevated.
So no, this isn't just an American story. If the AI earnings pillar cracks, Australian portfolios feel it.
What should investors actually do about it?
We're not saying sell everything and hide in cash. We are saying this is a terrible time to be complacent, and if your only reason for staying fully invested is "earnings estimates are holding up," you should probably get a second opinion on your positioning.
Here's what we'd be doing right now:
- Stress-test your US concentration. Add up your total US equity exposure across super, ETFs, and managed funds. If it's above 40%, you need to know what happens if S&P 500 earnings get cut 15% from here.
- Watch revisions, not levels. The direction of earnings revisions matters more than the headline growth rate. A widening spread of downgrades across sectors is the canary, not the absolute number.
- Separate earnings risk from valuation risk. 2022 proved that the market can fall 25% while earnings estimates hold up, because the discount rate changed. With yields at 19-year highs, that risk is live again.
- Don't wait for analysts to turn bearish. By the time consensus catches up, the market has already done most of the falling. Brown Advisory's data shows the index typically bottomed before the estimate trough, and was already up about 28% from its low by the time analysts finally hit their most pessimistic numbers.
- Consider defensive positioning. Gold (ASX: PMGOLD), quality dividend payers, and shorter-duration fixed income all tend to outperform when the growth trade unwinds. We've written about why every Australian portfolio needs a gold allocation and the reasoning hasn't changed.
Get an Independent View on Your Holdings
Markets are pricing perfection in a world with four active headwinds. Our portfolio review identifies concentration risk, earnings vulnerability and defensive gaps before the cycle turns.
Book Your Free Portfolio ReviewFrequently Asked Questions
Do earnings forecasts predict bear markets?
No. In the three earnings-driven bear markets since 2000, consensus analysts were still forecasting positive profit growth as the S&P 500 peaked. Estimates were cut 15–30% only after share prices had already fallen significantly. Analysts confirm the damage rather than predict it.
Are AI company earnings propping up the S&P 500 in 2026?
A significant portion of S&P 500 earnings growth is concentrated in a handful of AI-exposed mega-caps. Much of their reported earnings include unrealised gains from private investments in companies like Anthropic and OpenAI, which are marked to model rather than marked to market. If those valuations correct, the earnings picture deteriorates fast.
Why is September historically weak for stocks?
September is the worst-performing calendar month for the S&P 500, averaging negative returns since 1928. The weakness intensifies in US midterm election years, where September and October drawdowns have averaged roughly 1.5–2x the normal seasonal drag. Fund rebalancing, tax-loss harvesting, and political uncertainty all contribute.
How high is US government debt in 2026?
US federal debt has surpassed $40 trillion, with the government adding roughly $1 trillion every 100 days. Interest payments now exceed the defence budget. At current Treasury yields above 5%, debt servicing costs are crowding out fiscal spending and creating a structural drag on growth.
Should Australian investors worry about US earnings forecasts?
Yes. The ASX is heavily correlated with US equity markets, particularly during drawdowns. When the S&P 500 sells off, Australian equities typically follow within days. Investors holding US-exposed ETFs or global equity funds are directly vulnerable to any earnings-driven correction in US markets.
This article is general educational information and does not constitute personal financial advice. Past performance is not a guarantee of future results. Before making investment decisions, consider your personal circumstances, investment objectives, risk tolerance, and time horizon. Consult a licensed financial adviser if you need personalised advice. MPC Markets and its representatives provide general advice only. All examples are illustrative and do not constitute recommendations. Data is current as of September 2026 and is subject to change.