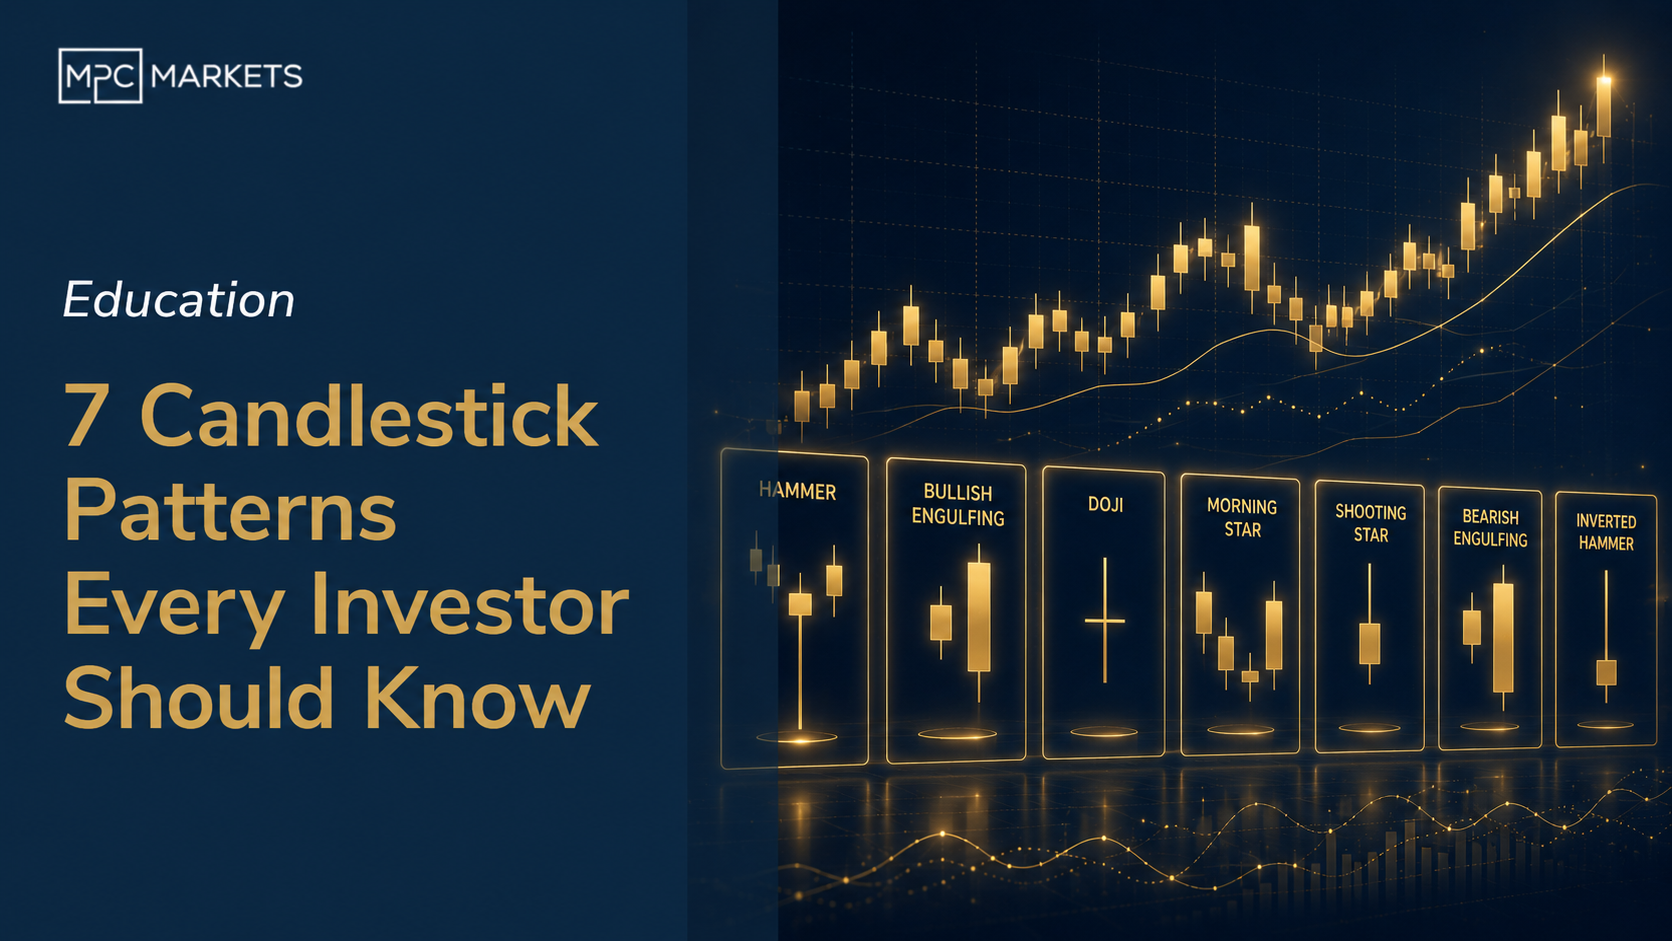
7 Candlestick Patterns Every Investor Should Know
Last reviewed: May 2026
We reckon candlestick charts are the single most useful visual tool an investor can learn to read. Bold claim, sure. But after years of looking at charts daily, we keep coming back to them because they show you something that a simple line chart never will: the story of what happened inside a trading session. Who was winning, who was losing, and who blinked first.
The funny thing is, this isn't new technology. A Japanese rice trader named Munehisa Homma developed candlestick charting in the 1700s to track rice futures in Osaka. The man was reading market psychology 250 years before behavioural finance became a thing. And the patterns he identified still work today on ASX stocks, US tech giants, crypto, commodities. Human psychology doesn't change much, it turns out.
Now, we should say upfront: candlestick patterns on their own are not a trading system. Anyone who tells you otherwise is selling something. They're clues. Pieces of evidence. You combine them with support and resistance levels, volume, and broader trend analysis, and now you've got something genuinely useful. Think of each pattern as a witness statement, not the verdict.
Here are the seven patterns we think matter most. Three bullish, three bearish, and one that tells you the market can't make up its mind.
How do candlestick charts actually work?
Before we get into specific patterns, a quick refresher on what you're actually looking at. Each candlestick represents a single time period. Could be a day, a week, an hour. The fat part (the body) shows you the range between where the price opened and where it closed. If the body is green (or white), the close was higher than the open. Red (or black) means it closed lower.
The thin lines sticking out the top and bottom are called wicks, or shadows if you want to sound more technical about it. The upper wick shows the highest price reached during that period. The lower wick shows the lowest. So a candle with a long lower wick and a small green body at the top tells you something specific: sellers pushed the price down hard, but buyers came in and drove it right back up. That's market psychology captured in a single bar.
And that's really what this whole exercise is about. Every pattern we're going to cover below is just a visual shorthand for a shift in who's in control: buyers or sellers. Once you start seeing them that way, they make a lot more intuitive sense.
What are the bullish candlestick patterns to watch for?
These three patterns appear after a stock has been falling and suggest the selling pressure might be running out of steam. We use the word "suggest" deliberately. These aren't guarantees, they're signals that deserve your attention.
The Hammer
The hammer is probably the most intuitive candlestick pattern there is. It appears during a downtrend. The candle has a small body near the top and a long lower wick, at least twice the length of the body. Little or no upper wick.
Here's what it's telling you. During that session, sellers drove the price down significantly. But then buyers stepped in with enough force to push the price back up near the open. The long lower wick is the evidence of that fight, and the buyers won it. It's called a hammer because the market is trying to hammer out a bottom.
We see hammers fairly regularly on ASX stocks after a sharp selloff. They don't always lead to a reversal, but when a hammer forms right at a known support level with above-average volume, that's worth paying attention to. That's three pieces of evidence pointing the same direction.
Bullish Engulfing
This one's a two-candle pattern and we reckon it's one of the more reliable signals out there. You need a small red candle followed by a larger green candle that completely covers, or "engulfs", the body of the red one.
What's happening is straightforward. The first day, sellers are still in charge but their conviction is fading (small body). The second day, buyers show up with real force and completely overwhelm the prior day's selling. The bigger the green candle relative to the red, the stronger the signal. A bullish engulfing where the green candle is three times the size of the red one is a much louder statement than one where they're barely different.
We particularly like this pattern when it appears after a pullback within an existing uptrend. That context, combined with the pattern, tells you the broader trend is reasserting itself.
Morning Star
The morning star is a three-candle formation and it's the most complex of the bullish patterns. Day one: a strong red candle, sellers are firmly in charge. Day two: a small-bodied candle (can be red or green) that gaps down from day one's close. Day three: a strong green candle that closes well into day one's body.
The middle candle is the pivot point. It shows that selling momentum has stalled. Sellers couldn't follow through. And then day three confirms that buyers have taken over. It's called a morning star because, like the actual morning star (Venus, if you're wondering), it signals that dawn is coming after a dark period.
Morning stars are reasonably rare compared to hammers or engulfing patterns, which is actually a good thing. When they do appear, they tend to carry more weight. Three sessions of data is more convincing than one.
Want a professional eye on your positions?
Our complimentary Portfolio Review analyses your holdings, entry points, and risk exposure. 30 minutes, no cost, no sales pitch.
Book Your Free Portfolio ReviewWhat are the bearish candlestick patterns that signal trouble?
These are the mirror images of the bullish patterns above. They show up after a price rally and suggest the buying momentum is fading. If you hold a stock that's had a good run, these are the patterns that should make you at least tighten your stop loss, even if you're not ready to sell.
The Shooting Star
The shooting star is essentially a hammer turned upside down, and it appears after an uptrend instead of a downtrend. Small body near the bottom of the candle, long upper wick, little or no lower wick.
The story here is that buyers pushed the price up significantly during the session, but then sellers came in hard and drove it back down near the open. All that buying enthusiasm got rejected. The long upper wick is the graveyard of failed optimism, if you'll forgive the dramatic phrasing.
Shooting stars are particularly useful when a stock has been running hard for several sessions. After a big move up you often see traders try to push it even higher, only to get slapped back. That's your shooting star. It doesn't mean the stock will definitely reverse, but the balance of power shifted during that session and that's worth noting.
Bearish Engulfing
Same concept as the bullish version, just reversed. A small green candle followed by a larger red candle that completely engulfs it. Day one, buyers are still pushing but without much conviction. Day two, sellers come in and overwhelm them entirely.
We pay particular attention to bearish engulfing patterns that form after a stock has rallied into a known resistance level. If a stock runs up to its previous high, forms a bearish engulfing, and does it on heavy volume? That's three signals telling you the same thing. Maybe the rally is done for now.
The other thing we'd note is that bearish engulfing patterns on weekly charts tend to carry more weight than on daily charts. A week's worth of selling overwhelming a week's worth of buying is a bigger deal than a single day's reversal.
Evening Star
The evening star is the bearish cousin of the morning star. Three candles again. Day one: strong green candle, buyers in full control. Day two: small-bodied candle that gaps up, showing hesitation at the top. Day three: strong red candle that drops back into day one's territory.
This pattern is essentially the market saying "we tried to go higher, couldn't sustain it, and now we're heading back down." The gap up on day two and subsequent failure is what makes this such a psychologically powerful formation. It's a failed breakout compressed into three candles.
Evening stars at all-time highs or at major resistance levels are the ones that really get our attention. Context, as always, is everything.
Looking for researched stock ideas?
Our Investment Recommendations give you specific, conviction-backed ideas with entry levels, targets, and risk management built in.
See Our Latest RecommendationsWhat does a Doji candlestick tell you?
The Doji is the seventh pattern and it sits in its own category: indecision. A Doji forms when the open and close are virtually identical, giving you a candle with almost no body, just a thin horizontal line with wicks extending above and below.
What's happening is that buyers and sellers fought to a standstill. Neither side could gain the upper hand by the end of the session. On its own, a Doji doesn't tell you much. Markets are indecisive all the time. But a Doji after a strong trend, either up or down, can signal that the momentum is fading and a reversal might be coming.
There are a few variations worth knowing. A long-legged Doji has very long wicks in both directions, showing extreme volatility that still ended in a draw. A dragonfly Doji has a long lower wick and no upper wick, which is similar to a hammer. A gravestone Doji has a long upper wick and no lower wick, similar to a shooting star. The names are dramatic but the concept is the same: the battle was fierce and nobody won.
We find Dojis most useful as a "heads up" rather than a trading signal. If you see a Doji at the top of a strong rally, it's not saying "sell now." It's saying "pay closer attention to what happens next." If the following candle confirms the reversal, you've got two pieces of evidence. That's when it becomes actionable.
How do all 7 candlestick patterns compare?
Here's a quick reference for the patterns we've covered. Keep in mind that reliability ratings are general. Every pattern becomes more reliable when it appears at a known support or resistance level with confirming volume.
| Pattern | Type | Signal | Reliability | What to Look For |
|---|---|---|---|---|
| Hammer | Bullish | Potential reversal up | Moderate | Lower wick 2x+ body length, appears in downtrend |
| Bullish Engulfing | Bullish | Potential reversal up | High | Green candle fully engulfs prior red candle's body |
| Morning Star | Bullish | Potential reversal up | High | Three candles: strong red, small body, strong green |
| Shooting Star | Bearish | Potential reversal down | Moderate | Upper wick 2x+ body length, appears in uptrend |
| Bearish Engulfing | Bearish | Potential reversal down | High | Red candle fully engulfs prior green candle's body |
| Evening Star | Bearish | Potential reversal down | High | Three candles: strong green, small body, strong red |
| Doji | Indecision | Momentum fading | Low alone | Open and close nearly equal, context-dependent |
How should you actually use candlestick patterns when investing?
Here's where we get a bit opinionated. We've seen too many people learn about candlestick patterns, get excited, and then start seeing them everywhere. Every hammer becomes a buy signal. Every shooting star means sell everything. That's not how this works.
The single biggest mistake with candlestick analysis is using patterns in isolation. A hammer forming in the middle of nowhere on a stock you know nothing about is just a shape on a chart. A hammer forming at a well-established support level, on a quality ASX stock with rising volume? That's worth acting on.
Confirmation is everything. We always look for at least two of these additional factors before putting any real weight on a candlestick pattern:
- Support or resistance: Is the pattern forming at a price level that has held before? A bullish pattern at support is far more meaningful than one floating in open space.
- Volume: Did volume increase when the pattern formed? Higher volume means more participants were involved in that price action, which makes the signal more legitimate.
- Trend context: Is this pattern forming in the direction of the larger trend, or against it? A bullish engulfing during an overall uptrend (a pullback reversal) is more reliable than one trying to call the bottom of a freefall.
- Timeframe: Weekly candle patterns tend to be more reliable than daily, and daily more reliable than hourly. More data in each candle means more meaningful patterns.
And one more thing. Candlestick patterns work best on liquid stocks with decent daily volume. On thinly traded ASX small caps, a single large order can create a pattern that looks perfect on the chart but is really just one fund manager moving the price around. Stick to stocks with reasonable turnover and you'll get better results.
We use candlestick analysis as part of a broader investment approach that includes fundamental research, risk management, and position sizing. The patterns give us better entry and exit timing, but the underlying investment thesis always comes first. Charts tell you when to act. Fundamentals tell you what to act on. You need both.
Learn chart reading in our free webinars
We cover technical analysis, candlestick patterns, and market structure in our regular webinar series. Free to attend.
Register for Free WebinarsFrequently Asked Questions
What are the most reliable candlestick patterns for stock trading?
The multi-candle patterns tend to be more dependable than single-candle signals. Engulfing patterns (both bullish and bearish) and the morning star and evening star formations are generally the most reliable because they show a complete shift in market sentiment over multiple sessions. That said, no candlestick pattern should be traded in isolation. You always want confirmation from volume, support and resistance levels, or other technical indicators.
How do I read a candlestick chart as a beginner?
Each candlestick shows four data points: the open, high, low, and close for a given time period. The thick body represents the range between open and close. Green means the price closed higher than it opened, red means it closed lower. The thin lines (wicks) show the highest and lowest prices reached. Once you can read individual candles, start looking for the recognisable patterns that suggest what buyers and sellers might do next.
Do candlestick patterns actually work on ASX stocks?
Yes. Candlestick patterns reflect universal human psychology around buying and selling, so they work on any liquid market including the ASX. They're most reliable on higher-volume stocks where there's enough participation to make the patterns meaningful. On thinly traded small caps, individual large orders can create shapes that look like patterns but are really just noise. Always check that the stock has reasonable daily volume before reading too much into a formation.
What is the difference between a hammer and a shooting star?
They're essentially the same shape in opposite contexts. A hammer appears after a downtrend with a small body at the top and a long lower wick, showing that sellers pushed prices down but buyers fought back. A shooting star appears after an uptrend with a small body at the bottom and a long upper wick, showing that buyers pushed prices up but sellers overwhelmed them. The context and location of the pattern is what gives it meaning.
Should I use candlestick patterns on their own to make investment decisions?
No. Candlestick patterns are one tool in a broader toolkit. They're most effective when combined with support and resistance analysis, volume confirmation, moving averages, and trend analysis. A bullish engulfing at a known support level with rising volume is a much stronger signal than the same pattern appearing randomly on a chart. Think of candlestick patterns as clues rather than commands.
Disclaimer: This article is general information only and does not constitute financial advice, a recommendation, or an offer to buy or sell any financial product. It has been prepared without taking into account your individual objectives, financial situation, or needs. Before making any investment decision, you should consider obtaining independent financial advice from a licensed adviser. Past performance is not indicative of future results. Investing involves risk, including the possible loss of capital. MPC Markets Pty Ltd (ABN 33 169 278 900) is a Corporate Authorised Representative of MPC Advisory Pty Ltd (AFSL 522 829).