What Is a Dividend Trap? How to Spot Unsustainable Yields on the ASX
Last reviewed: May 2026
Here's the thing about a fat dividend yield: sometimes it's a reward. And sometimes it's a warning siren that you're about to buy somebody else's problem.
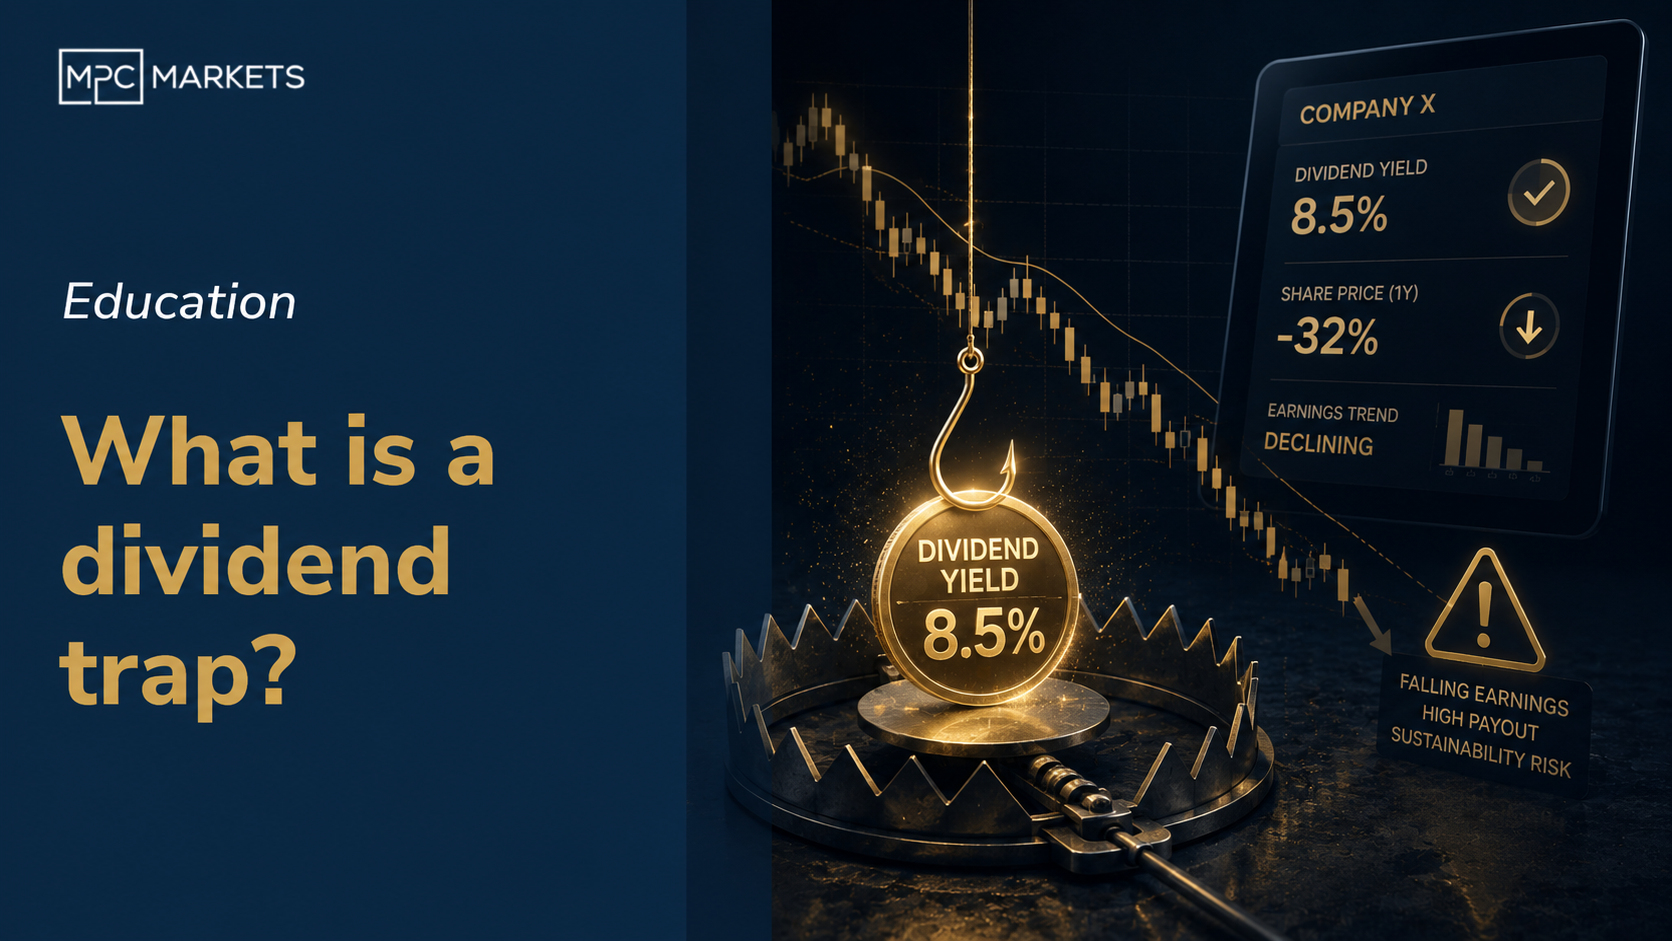
A dividend trap is a stock that looks like a dream on paper. The yield is sitting at 7%, 8%, maybe 9%. Fully franked. Your spreadsheet is practically glowing. But underneath that headline number, the business is deteriorating, the share price has been in freefall, and the dividend is about to get slashed. You buy in chasing income and you end up with less income and a capital loss. It's a two-for-one deal nobody asked for.
We see it constantly with Australian investors, especially SMSF trustees chasing income in retirement phase. The franking credits make high yields even more seductive on a grossed-up basis, and that's exactly when the maths starts working against you. So let's break down how dividend traps actually work, what the red flags look like, and what to do instead.
How does a dividend trap actually work?
The mechanics are embarrassingly simple once you see them. Dividend yield is just a formula: annual dividend per share divided by share price. So if a company pays 30 cents and the share price is $6.00, the yield is 5%. Perfectly normal.
But if the share price drops to $3.30 while the company is still technically paying that 30-cent dividend? The trailing yield jumps to 9%. Screen that on a yield filter and it looks incredible. Chuck franking credits on top and you're staring at a grossed-up yield north of 12%.
Here's the problem. The share price didn't fall for no reason. Earnings are declining. Revenue is under pressure. Free cash flow is thinning out. The company can't actually afford that 30-cent payout anymore. So within a few quarters, they announce a dividend cut. Now you're holding a stock that's down 40% with a yield that's half what you bought it for.
We reckon this is the single most expensive mistake income-focused investors make on the ASX. And it happens because people look at the yield number in isolation without checking whether the business can keep writing the cheque.
What are the red flags of a dividend trap?
There are five warning signs we always check before going anywhere near a high-yielding stock. Miss even one and you're probably looking at a trap.
1. Payout ratio above 80%
If a company is paying out more than 80% of its earnings as dividends, there's very little buffer. And if the payout ratio is over 100%, they're literally paying dividends they haven't earned. That's borrowing from the future, or worse, borrowing from the balance sheet. Neither ends well.
2. Declining earnings and revenue
A high yield only matters if the company can sustain it. If revenue has been falling for two or three years running, the dividend is living on borrowed time. Check the trend, not just the current number.
3. Weak free cash flow
Earnings can be massaged with accounting treatments. Cash flow is harder to fake. If the company's free cash flow doesn't cover the dividend by at least 1.5 times, the payout is under stress. We've seen plenty of companies report decent headline earnings while the cash flow statement tells a completely different story.
4. High debt levels
A company carrying heavy debt has obligations that sit above dividend payments in the queue. When cash gets tight, debt servicing comes first and dividends get cut. Watch the debt-to-equity ratio and interest coverage. If they're deteriorating while the yield is rising, that's your answer.
5. Yield dramatically higher than peers
If every bank stock is yielding 4-5% and one is sitting at 8%, don't assume you've found a bargain. The market is telling you something. A yield that's 50% or more above sector peers almost always means the share price has fallen for fundamental reasons that haven't fully played out yet.
Want reliable income without the dividend risk?
Our Fixed Coupon Notes deliver regular, predetermined payments without exposure to share price volatility or dividend cuts. Income you can actually plan around.
Explore Fixed Coupon NotesWhat does a dividend trap look like on the ASX?
Theory is one thing. Let's look at two real examples that most Australian investors will recognise.
Telstra (TLS): The one that caught everyone
Telstra is probably the most famous dividend trap in ASX history. For years it was the go-to income stock. Blue chip. Fully franked. Sitting in half the SMSFs in the country.
But as the NBN rollout disrupted its fixed-line revenue and competition increased in mobile, the share price began sliding from around $6.50. By late 2017 it was trading under $3. The trailing yield? Above 9%. Grossed-up with franking, investors were looking at something like 13%.
The problem was obvious if you looked at the cash flow statement instead of the yield. Telstra's earnings were shrinking, its core revenue was under structural pressure, and the 30.5-cent dividend was consuming virtually everything the company earned. In 2017, management cut the dividend to 22 cents. Then again to 16 cents. Investors who bought at $5.00 for the yield were now sitting on a 40%+ capital loss and nearly half the income they expected.
That's the textbook dividend trap in action. The high yield wasn't a signal to buy. It was a signal that the market had already priced in trouble that the dividend hadn't caught up with yet.
Woodside Energy (WDS): Cyclical earnings, questionable sustainability
Woodside is a different flavour. It's not a broken business, but it operates in a sector where earnings swing wildly with commodity prices. When oil and LNG prices are high, Woodside throws off enormous cash and the dividends look spectacular. When prices correct, those payouts become much harder to sustain.
Add in Woodside's heavy capital expenditure on new LNG projects, and you've got a company where the headline yield can look extremely attractive right at the point where the cycle is about to turn. Investors who bought in late 2022 when the yield was elevated found out the hard way that resource company dividends are not the same as bank dividends.
We're not saying Woodside is a bad company. But chasing its yield without understanding the cyclicality of its earnings is a classic trap behaviour.
Got high-yielders in your portfolio?
Book a free Portfolio Review and we'll check whether your income stocks are genuinely sustainable or sitting on a trap.
Book Your Free ReviewHow do you check if a dividend is actually sustainable?
We use a simple scorecard approach. You don't need a Bloomberg terminal for this. Most of the data is available on the ASX company announcements page, Morningstar, or even a decent broker platform.
| Metric | Healthy Range | Warning Sign | Danger Zone |
|---|---|---|---|
| Payout Ratio | < 60-70% | 70-90% | > 90% (or >100%) |
| FCF Coverage | > 1.5x | 1.0-1.5x | < 1.0x |
| Debt-to-Equity | < 0.5 | 0.5-1.0 | > 1.0 (rising) |
| Yield vs Peers | Within 20% | 20-50% above | > 50% above |
| Dividend Growth | Steady/growing 5+ yrs | Flat or erratic | Cut in last 3 years |
Look, the maths is pretty clear. If a stock ticks green across most of those columns, the dividend is probably well supported. Two or more in the danger zone? Walk away. It doesn't matter how good the grossed-up yield looks in your SMSF projection.
How can you avoid dividend traps in your portfolio?
Avoiding traps isn't about avoiding dividends altogether. Plenty of ASX companies pay excellent, well-covered dividends year after year. CBA has been remarkably consistent. Defensive sectors like consumer staples and healthcare tend to maintain payouts through cycles. Some income-focused ETFs solve the problem by spreading across dozens of dividend payers so one cut doesn't sink you.
Here's what we tell clients:
Target payout ratios under 60-70%. This gives the company breathing room. If earnings dip 20% in a tough year, they can still maintain the dividend without stretching.
Focus on free cash flow, not just earnings. A company can report solid earnings per share while its actual cash generation tells a different story. Dividends are paid in cash, not accounting profits. Make sure the FCF covers the payout at least 1.5 times.
Look for consistent payers in defensive sectors. Companies with subscription-style revenue, essential services, or contracted cash flows tend to maintain dividends better than cyclical businesses. Think of the difference between a toll road operator and a mining company.
Don't let franking credits cloud your judgement. Franking is genuinely valuable for Australian investors. But a fully franked 8% yield that gets cut to 4% is worse than an unfranked 5% yield that stays consistent. The grossed-up yield is only useful if the underlying dividend is sustainable.
Diversify your income sources. Relying on three or four high-yielding stocks for your retirement income is asking for trouble. Spread across diversified ETFs, fixed income, and structured products so a single dividend cut doesn't blow up your cash flow plan.
Are there smarter ways to generate income from your portfolio?
This is where we get a bit biased, but we reckon it's worth hearing out. If you're an income investor who's tired of checking whether your dividends are about to get cut, there are alternatives that remove that uncertainty entirely.
Fixed Coupon Notes pay a predetermined coupon at regular intervals. The income doesn't depend on a company's board deciding to maintain the dividend or on earnings coming in above expectations. You know what you're getting and when. For retirees or SMSF investors who need to plan cash flow, that predictability is worth a lot.
Smart Entry Notes give you exposure to blue-chip ASX stocks but at a discount to the current market price. If the stock falls to your entry level, you buy in cheaper than where it was trading. If it doesn't, you earn a coupon. Either way, you're not buying at the top and hoping the dividend holds.
Principal Protected Notes are for investors who genuinely can't afford to go backwards. You get market-linked returns with a guarantee that your initial capital is returned at maturity. The trade-off is you won't capture 100% of the upside, but you also won't be sitting on a 40% loss wondering what happened.
We cover these in detail in our Structured Investments Explained guide. But the core point is simple: if your primary goal is reliable income, you don't have to accept the uncertainty of dividends. There are instruments specifically designed to solve that problem.
And if you're thinking the old "buy blue chips and collect dividends" approach is still bulletproof, the Telstra example alone should give you pause.
Protecting your capital while earning income
Our Wealth Protector strategy combines defensive positioning with income generation for investors who can't afford to go backwards.
Learn About Wealth ProtectorFrequently Asked Questions
What is a dividend trap?
A dividend trap is a stock with a high trailing yield that's unsustainable. The yield looks attractive because the share price has fallen sharply, but the underlying business can't afford to keep paying at that level. When the inevitable dividend cut comes, you cop both reduced income and a capital loss.
How can I tell if a high dividend yield is sustainable?
Check five things: payout ratio (under 70% is healthy), free cash flow coverage (at least 1.5 times the dividend), the earnings trend (stable or growing), debt levels (debt-to-equity under 1.0), and whether the yield is dramatically higher than sector peers. If two or more of those metrics are flashing red, the dividend is probably at risk.
Why do dividend traps happen so often in Australia?
Australia's imputation system makes franking credits highly valuable, particularly for SMSF investors in pension phase who get a full refund. This creates extra demand for high-yielding fully franked stocks, and that demand can keep people buying even when the fundamentals no longer support the payout. The grossed-up yield obscures the real risk.
Is Telstra a good example of a dividend trap?
Yes. Telstra's trailing yield climbed above 9% by late 2017 as the share price fell from around $6.50 to under $3. The company then cut its dividend from 30.5 cents to 16 cents per share. Investors who bought for the headline yield suffered significant capital losses and received far less income than they expected.
What are alternatives to high-yield stocks for portfolio income?
Income ETFs spread dividend risk across dozens of companies. Fixed income products like bonds and bond ETFs provide more predictable payments. Structured products such as Fixed Coupon Notes deliver predetermined income without dependence on a company's dividend policy. Diversifying across these sources reduces the chance that a single cut derails your income plan.