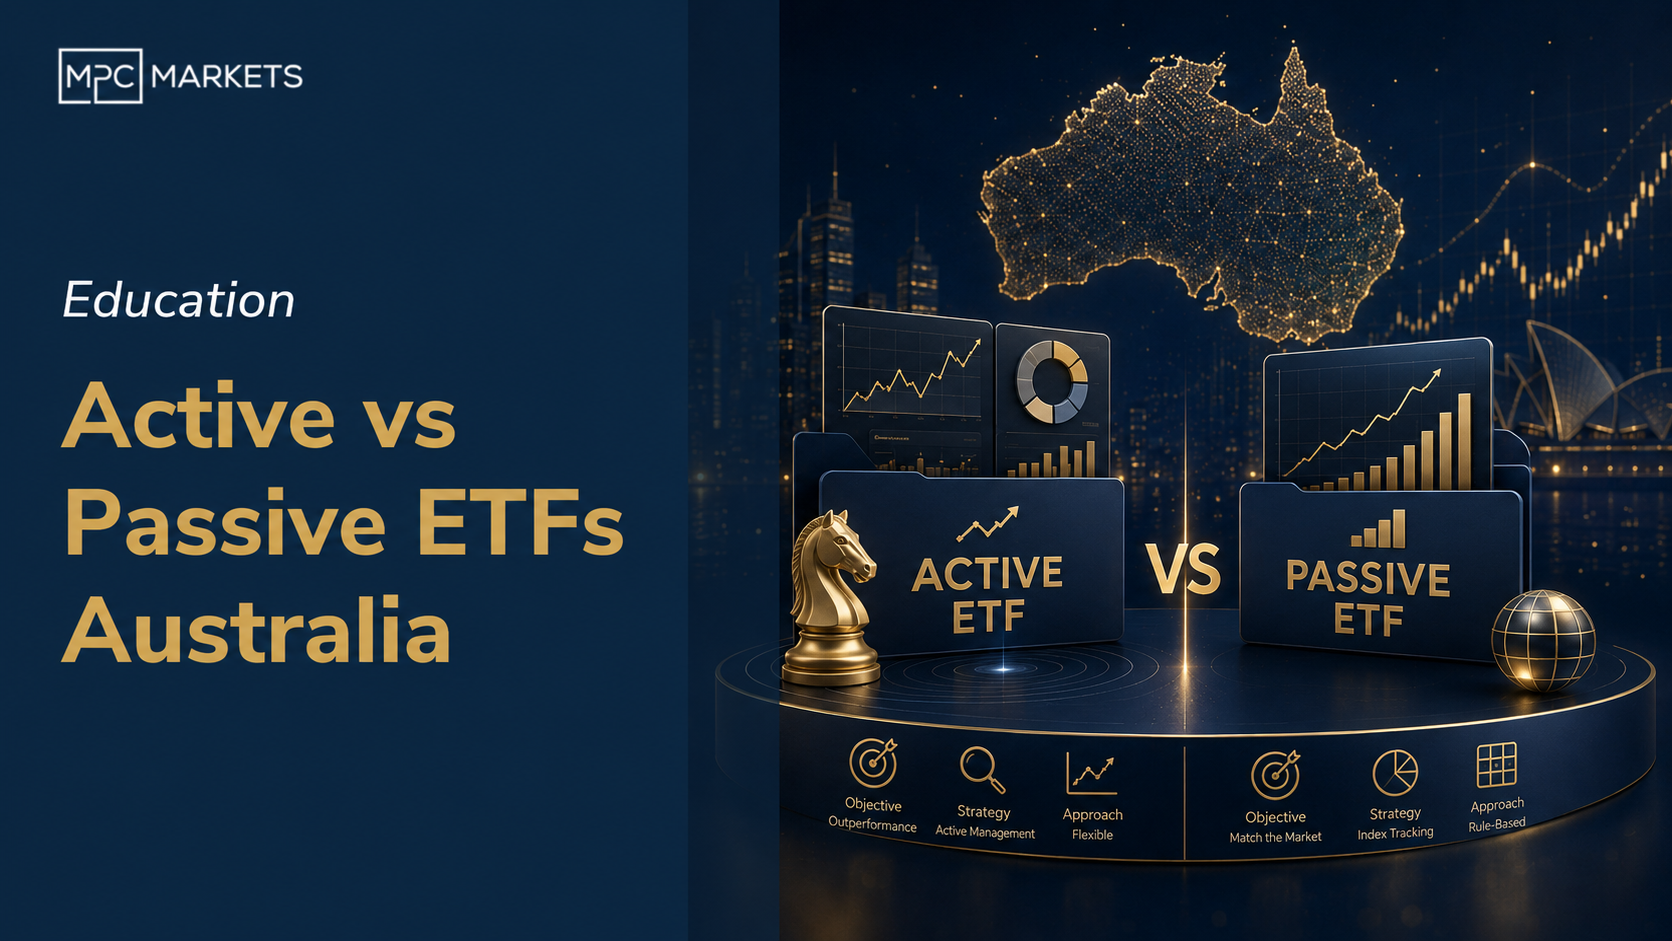
Active vs Passive ETFs: What Australian Investors Need to Know
Last reviewed: May 2026
We'll be upfront about this: for most Australian investors, passive ETFs win. The data has been clear on that point for decades now. But, and this is where it gets interesting, it's not a completely black-and-white call. There are pockets where active management can earn its keep, and knowing where those pockets are is worth your time.
Get the active-versus-passive decision wrong and you're handing tens of thousands of dollars to fund managers over a career. Get it right and you keep that money compounding in your own account. So let's walk through what actually matters here.
What is the difference between active and passive ETFs?
Passive ETFs track an index. They buy all (or a representative sample of) the companies in that index and hold them. No stock picking. No market timing. No one trying to be clever. VAS tracks the ASX 300. VGS tracks global developed markets. The fund just mirrors the index, and your return matches the index minus a small fee.
Active ETFs employ a portfolio manager or team who analyse companies, make buy and sell decisions, and try to beat the index. They overweight what they think is undervalued, underweight what looks expensive, and generally try to add value through skill and research.
The fundamental trade-off is simple: passive is cheap and reliable, active is expensive and uncertain. The question is whether that uncertainty pays off often enough to justify the cost.
| Feature | Passive ETFs | Active ETFs |
|---|---|---|
| Typical MER | 0.03%–0.25% | 0.40%–1.50% |
| Investment approach | Replicates an index | Manager picks holdings |
| Goal | Match the market | Beat the market |
| Trading frequency | Low (only when index changes) | Higher (regular portfolio adjustments) |
| 10-year outperformance rate | Is the benchmark | 15%–30% of managers beat it |
How much more do active ETFs cost?
Let's start with the clearest fact in this whole debate: active management is expensive, and that cost is a genuine drag on returns.
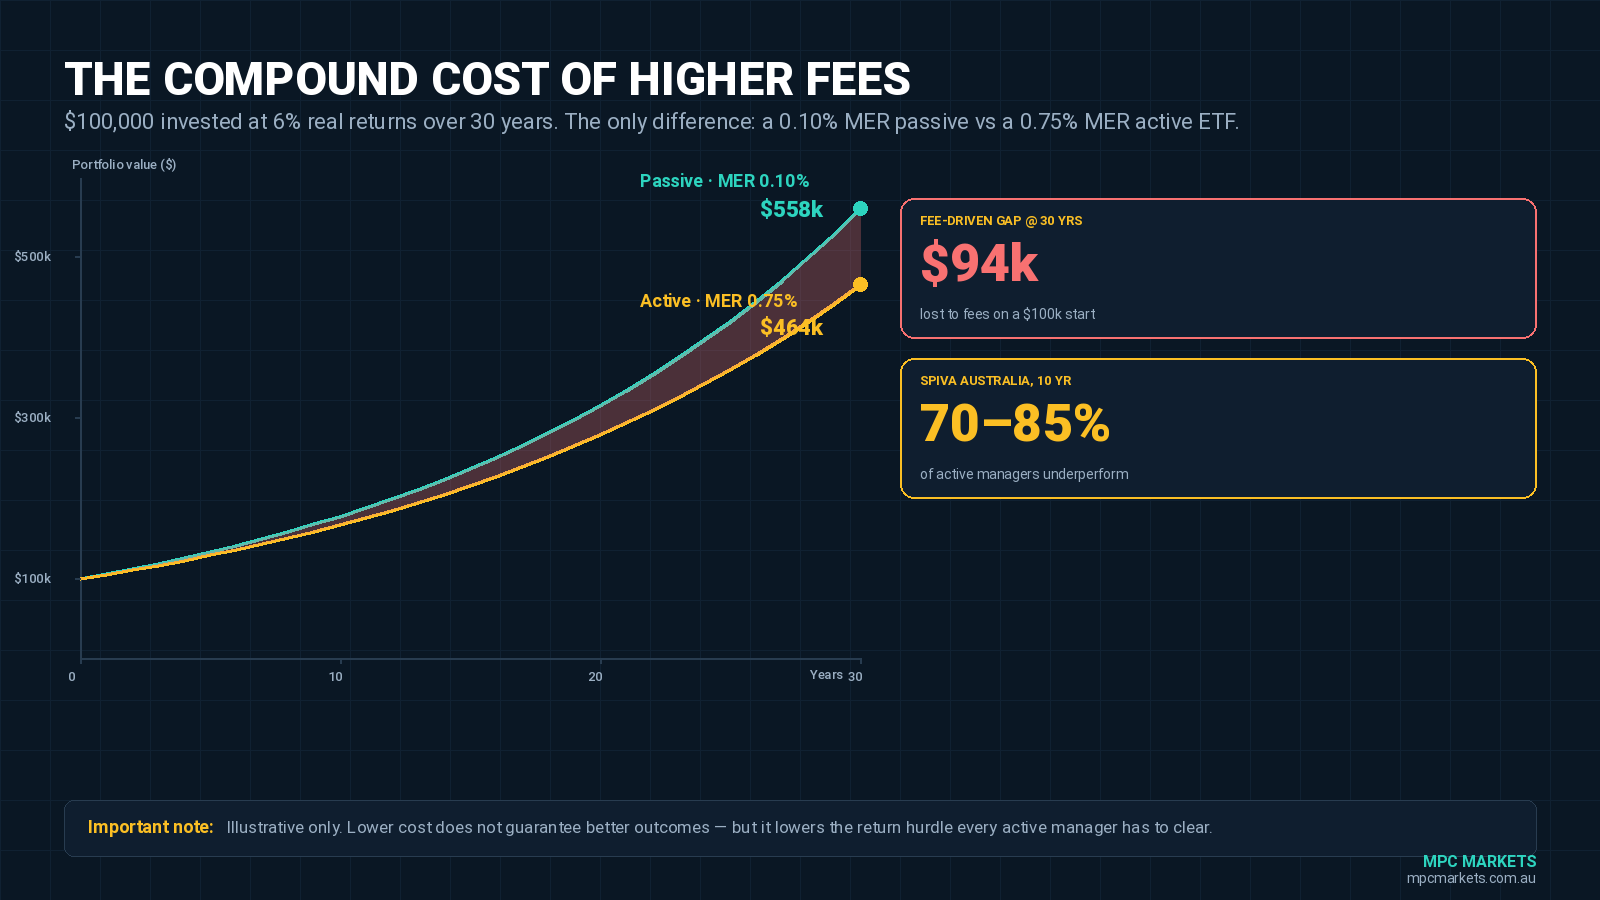
A passive Australian shares ETF costs 0.07% to 0.15% per year. An active Australian shares ETF or managed fund runs 0.50% to 1.50% per year. That's a 0.35% to 1.35% annual headwind before the active manager has added any value whatsoever.
On a $100,000 portfolio, 1% per year is $1,000 in fees. Over 30 years, compounding at 6% real returns, that fee difference grows to between $80,000 and $100,000 in wealth you never see. And that's assuming the active manager actually matches the index gross of fees, which most don't.
| Scenario | Annual Fee | 30-Year Cost on $100k (at 6% growth) |
|---|---|---|
| Passive ETF | 0.10% | Approximately $17,000 |
| Active ETF | 0.75% | Approximately $95,000 |
| Difference | 0.65% | Approximately $78,000 |
That's a lot of money to hand over, particularly when the active manager needs to beat the index by more than their fee just to break even with the passive option. Most can't do it consistently.
Paying too much in fund fees?
Book a complimentary MPC Portfolio Review and we'll show you where the fee drag is costing you. 30 minutes, no cost, no obligation.
Book a Portfolio ReviewDo active managers actually beat the market?
Here's the uncomfortable bit. Decades of data say: mostly, no.
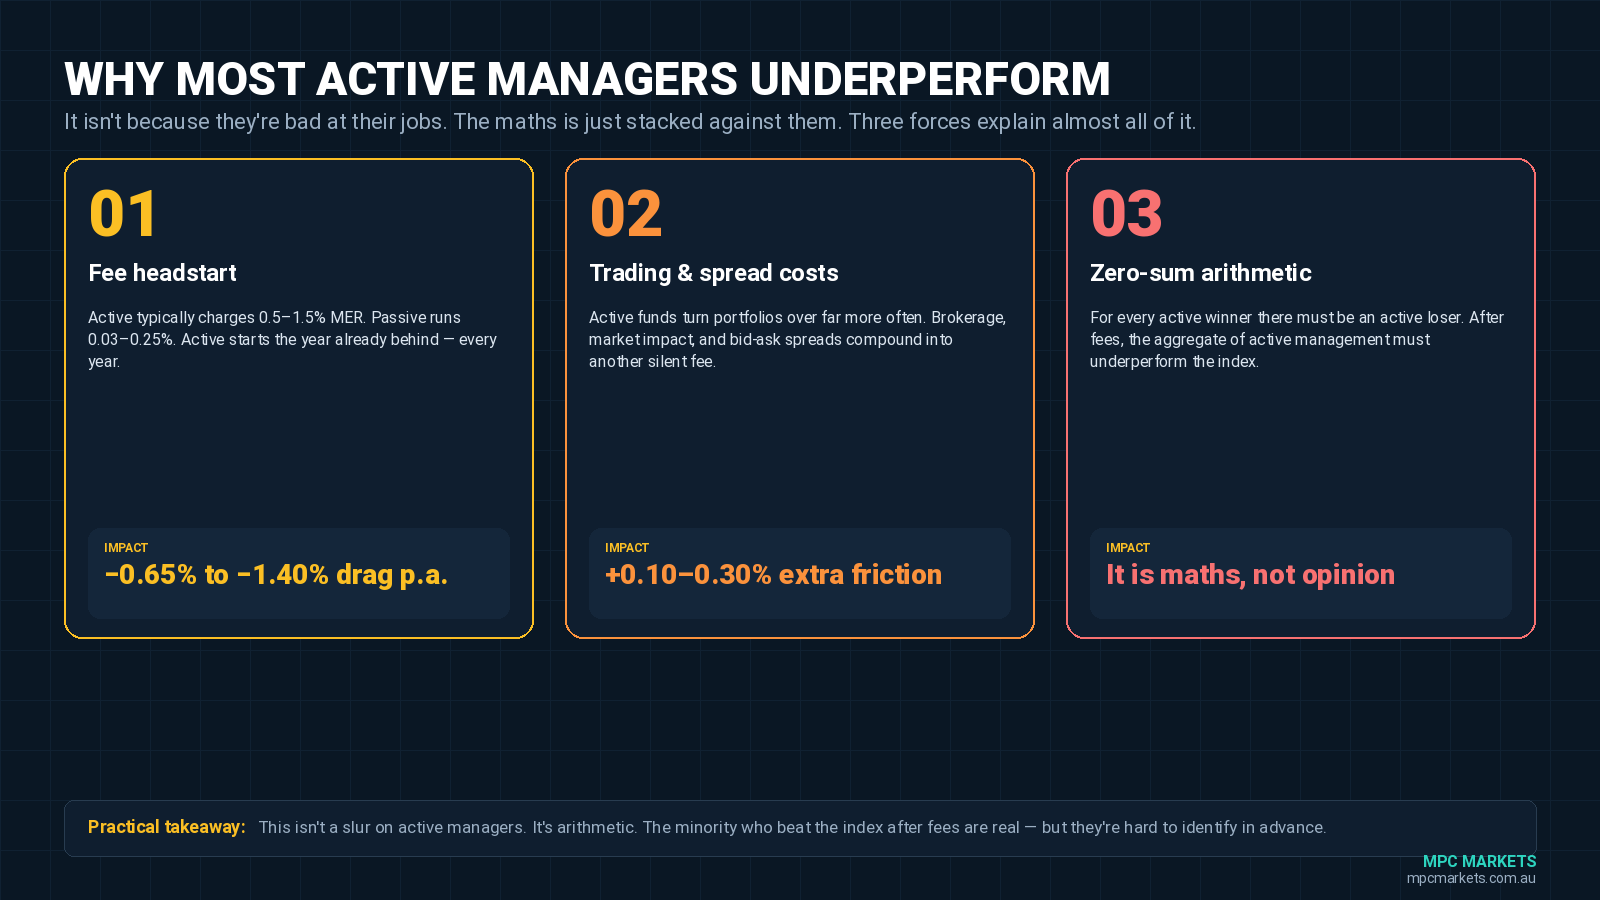
SPIVA Australia scorecards have been tracking this for years, and the numbers are pretty consistent. Around 70% to 85% of active Australian equity managers underperform the ASX 200 over 10-year periods, after fees. For global equities, the numbers are even worse. And this isn't because these managers are bad at their jobs. Many are genuinely sharp, hard-working people. The underperformance is structural.
The fee drag starts on day one. Active pays 1%, passive pays 0.10%, so passive begins with a 0.90% head start every single year. Trading costs add up. Active managers trade more frequently, racking up brokerage, bid-ask spreads, and market impact costs that come directly out of returns. It's a zero-sum game. For every dollar an active manager wins, another active manager loses. On aggregate, active must underperform passive by exactly the amount of the extra costs involved.
This isn't opinion. It's arithmetic. We didn't invent it, we just think more people should hear it said plainly.
When can active ETFs actually justify their fees?
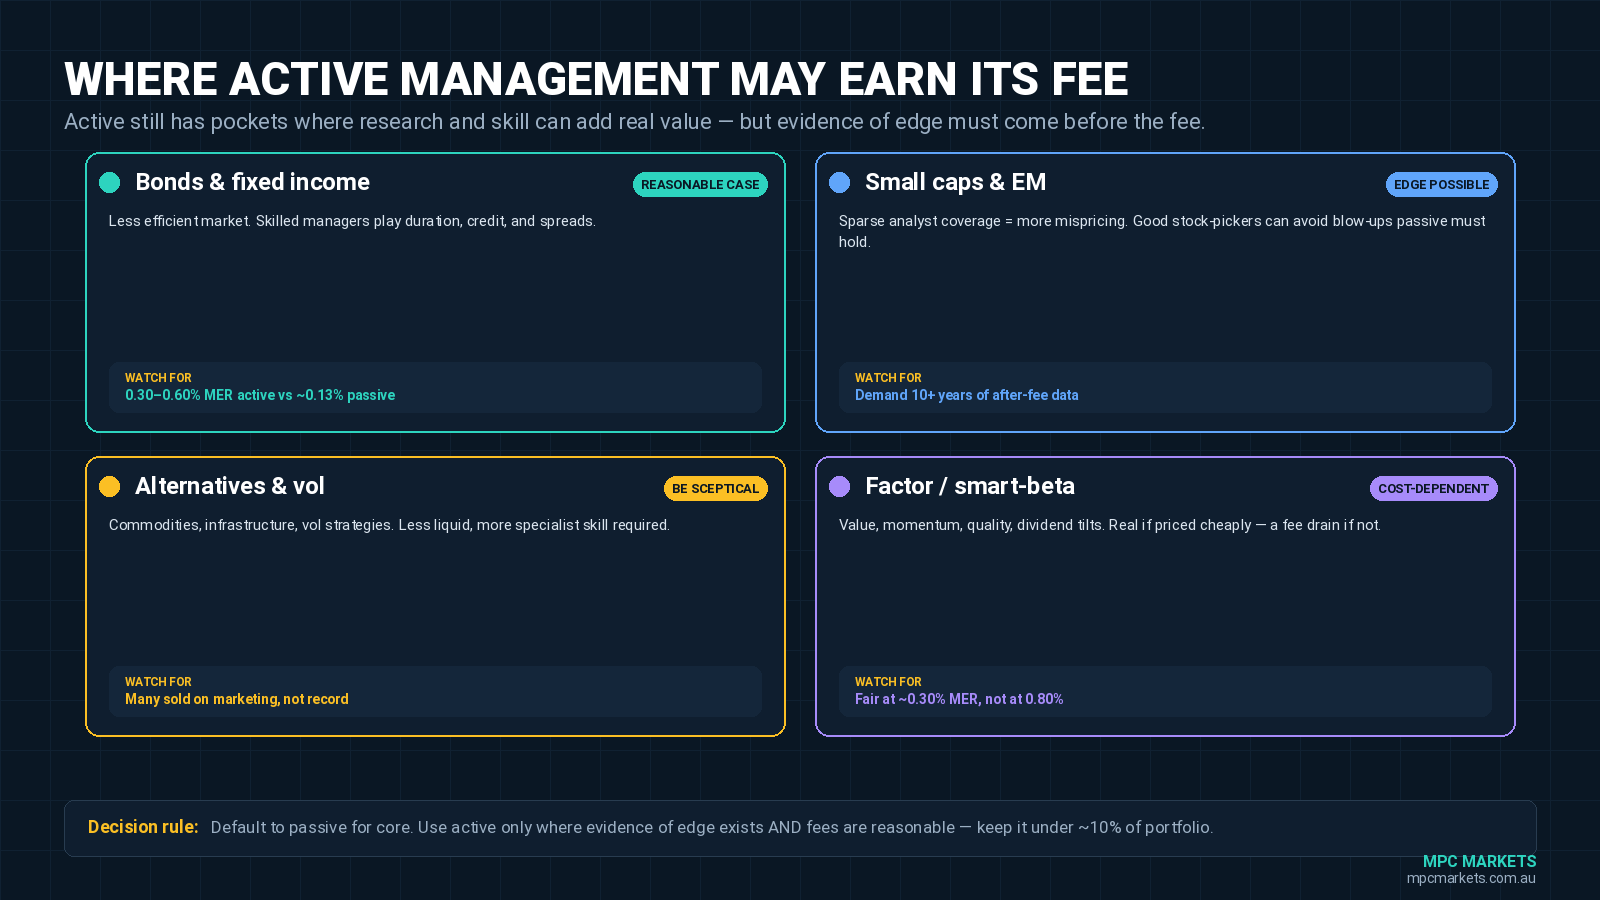
We said "most investors should go passive," not "all investors always." There are genuine exceptions, and they're worth knowing about.
Fixed income and bonds
Bond markets are less efficient than equity markets. A skilled active bond manager can find mispricings, play duration and credit spreads, and add real value. If the active bond ETF costs 0.30% more than passive but delivers 0.50% or more in outperformance, that's a fair trade. Bonds are honestly the one area where we think active has a reasonable case. But you still need to verify the manager's track record before committing.
Small caps and emerging markets
Less analyst coverage means more mispricing, and more mispricing means more room for a good stock picker to earn their fee. An active emerging markets fund that avoids companies with dodgy governance, excuse the broad brush, might save you from a blow-up that a passive index fund would ride straight into. The edge is real here, though it's not guaranteed.
Alternatives and specialist strategies
Commodities, infrastructure, volatility strategies. Less liquid, less researched, more room for skill. Some systematic active approaches have genuinely held their own against passive alternatives in these areas. But be sceptical, because plenty of alternative funds are sold on marketing hype rather than performance.
Factor-based strategies
Some active ETFs target specific factors like value, momentum, quality, or dividends. The question is whether the factor premium is real and whether the fund delivers it at a reasonable cost. A dividend ETF charging 0.30% MER for genuine high-yield exposure might be worth it. The same strategy at 0.80% MER is just another fee drain dressed up in smart-sounding language.
Want active stock selection backed by genuine research?
Our Investment Recommendations give you specific, researched ideas without the fund manager fee structure. Individual conviction calls, not a black box.
View Investment RecommendationsHow do specific Australian ETFs compare: active vs passive?
Australian shares
| Approach | Example | MER | Our Take |
|---|---|---|---|
| Passive | VAS, A200 | 0.07%–0.10% | Our default. Wins 9 times out of 10. |
| Active | Various (Perpetual, Janus Henderson, etc.) | 1.0%+ | Data says most won't beat VAS over 10+ years. |
Global shares
| Approach | Example | MER | Our Take |
|---|---|---|---|
| Passive | VGS (unhedged), VGAD (hedged) | 0.18%–0.21% | The default. Hard to argue with 2,000 companies at this price. |
| Active | Various boutique managers | 0.50%+ | Demand 10+ years of data. Most disappoint. |
Bonds
| Approach | Example | MER | Our Take |
|---|---|---|---|
| Passive | VBND | 0.20% | Solid, cheap, does the job. |
| Active | Various active bond funds | 0.30%–0.60% | This is the one area where active is defensible. But check the record. |
What should most investors actually do?
We reckon the answer is fairly straightforward if you're building a core portfolio with a 10-plus year horizon.
Put roughly 65% in passive large-cap index ETFs. VAS for Australia, VGS or VGAD for global. These are the bread and butter, no compromise. Allocate around 25% to bonds, using VBND as a passive default unless you've got genuine conviction in a specific active bond manager with a proven record. And keep about 10% as a tactical satellite allocation for thematic ETFs, factor tilts, or alternatives. This is where you can explore active or niche strategies if you want to. But keep it small. It's for tilts, not for your financial foundation.
The formula, if you can call it that: passive for the heavy lifting, active only where you've got evidence and conviction. Boring? Absolutely. Effective? The data says overwhelmingly yes.
Can you actually pick the winning active managers?
Here's the bit nobody wants to hear. If you're asking "should I buy active ETFs?", the answer is probably no. Because the people who can consistently identify winning active managers are the ones who've spent years deep in this research. If you're still asking the question, you probably don't have the edge yet. And that's fine.
Default to passive. If, over time, you become genuinely convinced that a specific active manager has real edge (backed by 10-plus years of data, not just a good marketing deck), allocate 5% to 10% of your portfolio to that conviction bet. But don't pollute your core holdings with active management just because it feels like you should be doing something more sophisticated.
Boring beats clever. Passive beats active. The data says so, and we reckon it'll keep saying so.
Stay across the market without the noise
Join our free webinars for ongoing analysis and education you can actually use.
Browse Upcoming WebinarsFrequently Asked Questions
What is the difference between active and passive ETFs?
A passive ETF tracks an index by holding the same securities in the same proportions. No human manager decides which stocks to buy or sell. An active ETF has a portfolio manager who makes investment decisions, aiming to outperform the index through stock selection or timing. Active ETFs carry higher fees and more variable performance.
Do active ETFs outperform passive ETFs in Australia?
Most do not. SPIVA Australia data shows that 70% to 85% of active Australian equity managers underperform the ASX 200 over 10-year periods after fees. The evidence strongly favours passive for core equity exposure, though exceptions exist in fixed income, small caps, and alternatives.
Are active ETFs worth the higher fees?
For core equity exposure, the evidence says no for most investors. The 0.5% to 1.0% fee difference compounds significantly over decades. Active ETFs can potentially justify fees in inefficient markets (small caps, emerging markets), fixed income strategies, and some alternative strategies. Evaluate each fund on its specific long-term after-fee track record.
What is a typical management fee for passive vs active ETFs?
Passive index ETFs on the ASX charge 0.03% to 0.25% annually. Broad Australian shares ETFs like VAS and A200 sit at 0.07% to 0.10%. Active ETFs generally charge 0.40% to 1.50%. On a $100,000 portfolio, the difference between 0.10% and 0.75% is $650 per year, compounding to over $50,000 in lost wealth over 30 years.
Should I use active or passive ETFs for my portfolio?
For most long-term investors, passive index ETFs should form the core. Use passive for large-cap Australian and global shares. Consider active only for bonds, alternatives, or niche strategies where you have genuine conviction backed by a manager's proven track record. Keep any active allocation small, around 10% of the total portfolio at most.
Disclaimer: This article is general educational information and does not constitute financial advice. Past performance is not a guarantee of future results. ETF performance data is subject to market conditions and manager changes. Before investing, consider your personal circumstances, investment objectives, risk tolerance, and time horizon. Consult a licensed financial adviser if you need personalised advice. MPC Markets and its representatives do not hold Australian Financial Services Licences and do not provide personal financial advice. All ETF references (VAS, VGS, VGAD, VBND, A200) are examples and do not constitute recommendations. Performance figures and MER data are current as of May 2026 and are subject to change. Active fund underperformance statistics are based on historical data; individual managers may perform differently in the future.